The Sessions view in the Netra dashboard provides a centralized place to monitor user interactions, track custom events, and analyze session-level performance metrics. This section explains how to set up session tracking in your code and how to view and analyze sessions in the dashboard.

Setting Up Session Tracking

Before viewing sessions in the dashboard, you need to set up session tracking in your application code.

Initialize the Netra SDK

from netra import Netra
from netra.instrumentation.instruments import InstrumentSet

# Initialize with default settings
Netra.init(app_name="Your application name")

# Or with custom configuration
api_key = "Your API key"
headers = f"x-api-key={api_key}"
Netra.init(
    app_name="Your application name",
    headers=headers,
    trace_content=True,
    environment="Your Application environment",
    instruments={InstrumentSet.OPENAI}
)

Set Session Identifiers

Track specific users, sessions, and tenants with unique identifiers:
# Set session identification
Netra.set_session_id("unique-session-id")
Netra.set_user_id("user-123")
Netra.set_tenant_id("tenant-456")

Add Custom Context Attributes

Enrich your session data with custom attributes for better analysis:
# Add custom context attributes
Netra.set_custom_attributes(key="customer_tier", value="premium")
Netra.set_custom_attributes(key="region", value="us-east")
Netra.set_custom_attributes(key="plan_type", value="enterprise")

Record Custom Events

Track important business and technical events:
# Record user feedback event
Netra.set_custom_event(event_name="user_feedback", attributes={
    "rating": 5,
    "comment": "Great response!",
    "timestamp": "2024-01-15T10:30:00Z",
    "category": "positive"
})

# Record conversion event
Netra.set_custom_event(event_name="conversion", attributes={
    "type": "subscription",
    "plan": "premium",
    "value": 99.99,
    "currency": "USD",
    "source": "website",
    "campaign": "spring_sale"
})

# Record error event
Netra.set_custom_event(event_name="error_occurred", attributes={
    "error_type": "authentication",
    "error_message": "Invalid credentials",
    "severity": "high",
    "user_action": "login"
})

Viewing Sessions in the Dashboard

The Sessions dashboard displays all your application sessions with their associated traces. Each session shows key information including session ID, creation time, duration, number of traces, and total cost.
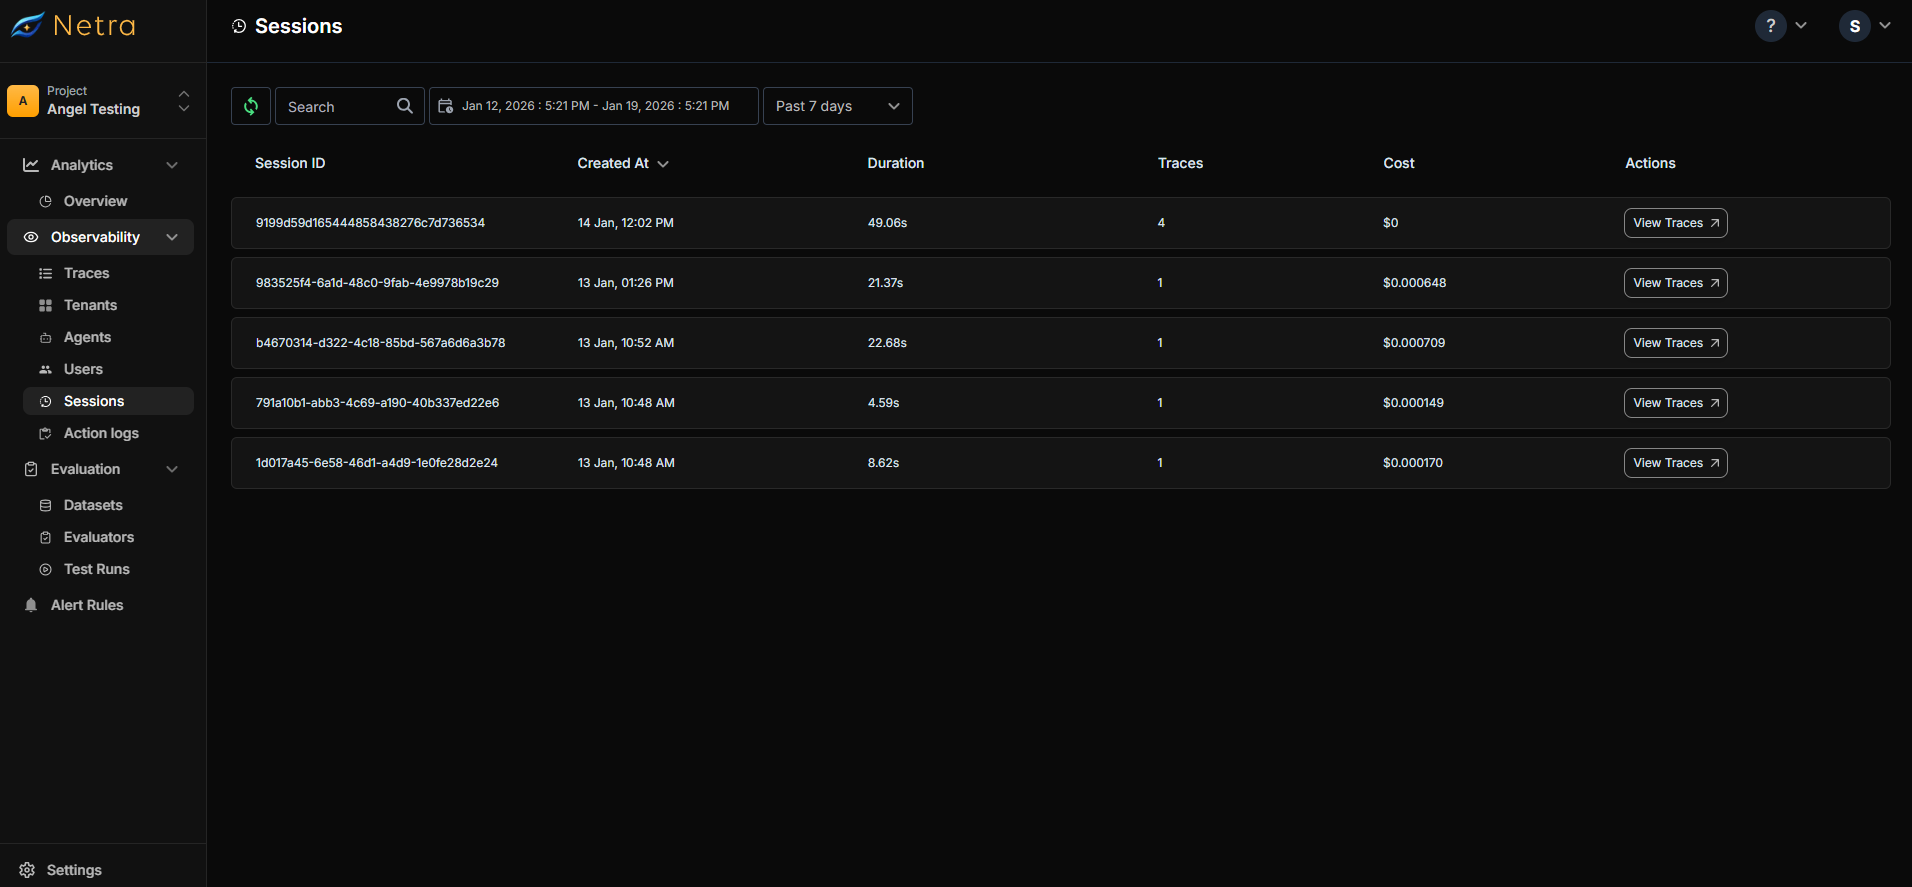
 Sessions dashboard

Features

  • Filter & Search: Filter sessions by date, time range, or search by session/user ID
  • Refresh Data: Manually refresh to see the latest sessions
  • View Columns: SessionId, CreatedAt, Duration, Traces, Cost, and Actions button
Click the Actions button to navigate to the trace view and inspect all traces associated with that session.

Use Cases

  • Debugging User Issues: Retrieve a specific user’s session to review all their interactions and traces
  • Cost Analysis: Identify expensive sessions by viewing total cost per session
  • Performance Monitoring: Track session duration and number of traces to monitor application behavior
  • Error Investigation: Find sessions with failed traces to diagnose issues quickly
  • User Analytics: Analyze session patterns to understand user behavior and engagement

Next Steps

  • Users - Track individual users across sessions
  • Tenants - Organize sessions by tenant for multi-tenant applications
  • Traces Overview - Deep dive into trace data within sessions
Last modified on February 3, 2026