
Open in Google Colab
Run the complete notebook in your browser
All company names (TaskBot, ShopFlow) and scenarios in this cookbook are entirely fictional and used for demonstration purposes only.
What You’ll Learn
Trace the Reasoning Loop
Capture each iteration of thought → action → observation with Netra spans
Track Tool Calls
Monitor tool invocations with latency, inputs, outputs, and cost
Debug Agent Behavior
Understand why your agent made specific decisions using trace analysis
Add Custom Context
Enrich traces with user IDs, session context, and custom attributes
Prerequisites:
- Python >=3.10, <3.14
- OpenAI API key
- Netra API key (Get started here)
- LangChain installed
Why Trace Agents?
Unlike simple LLM calls, agents involve multi-step reasoning that can fail in subtle ways:
Without visibility into the reasoning loop, debugging these failures requires guesswork.
The ReAct Pattern
ReAct (Reasoning + Acting) agents follow an iterative loop: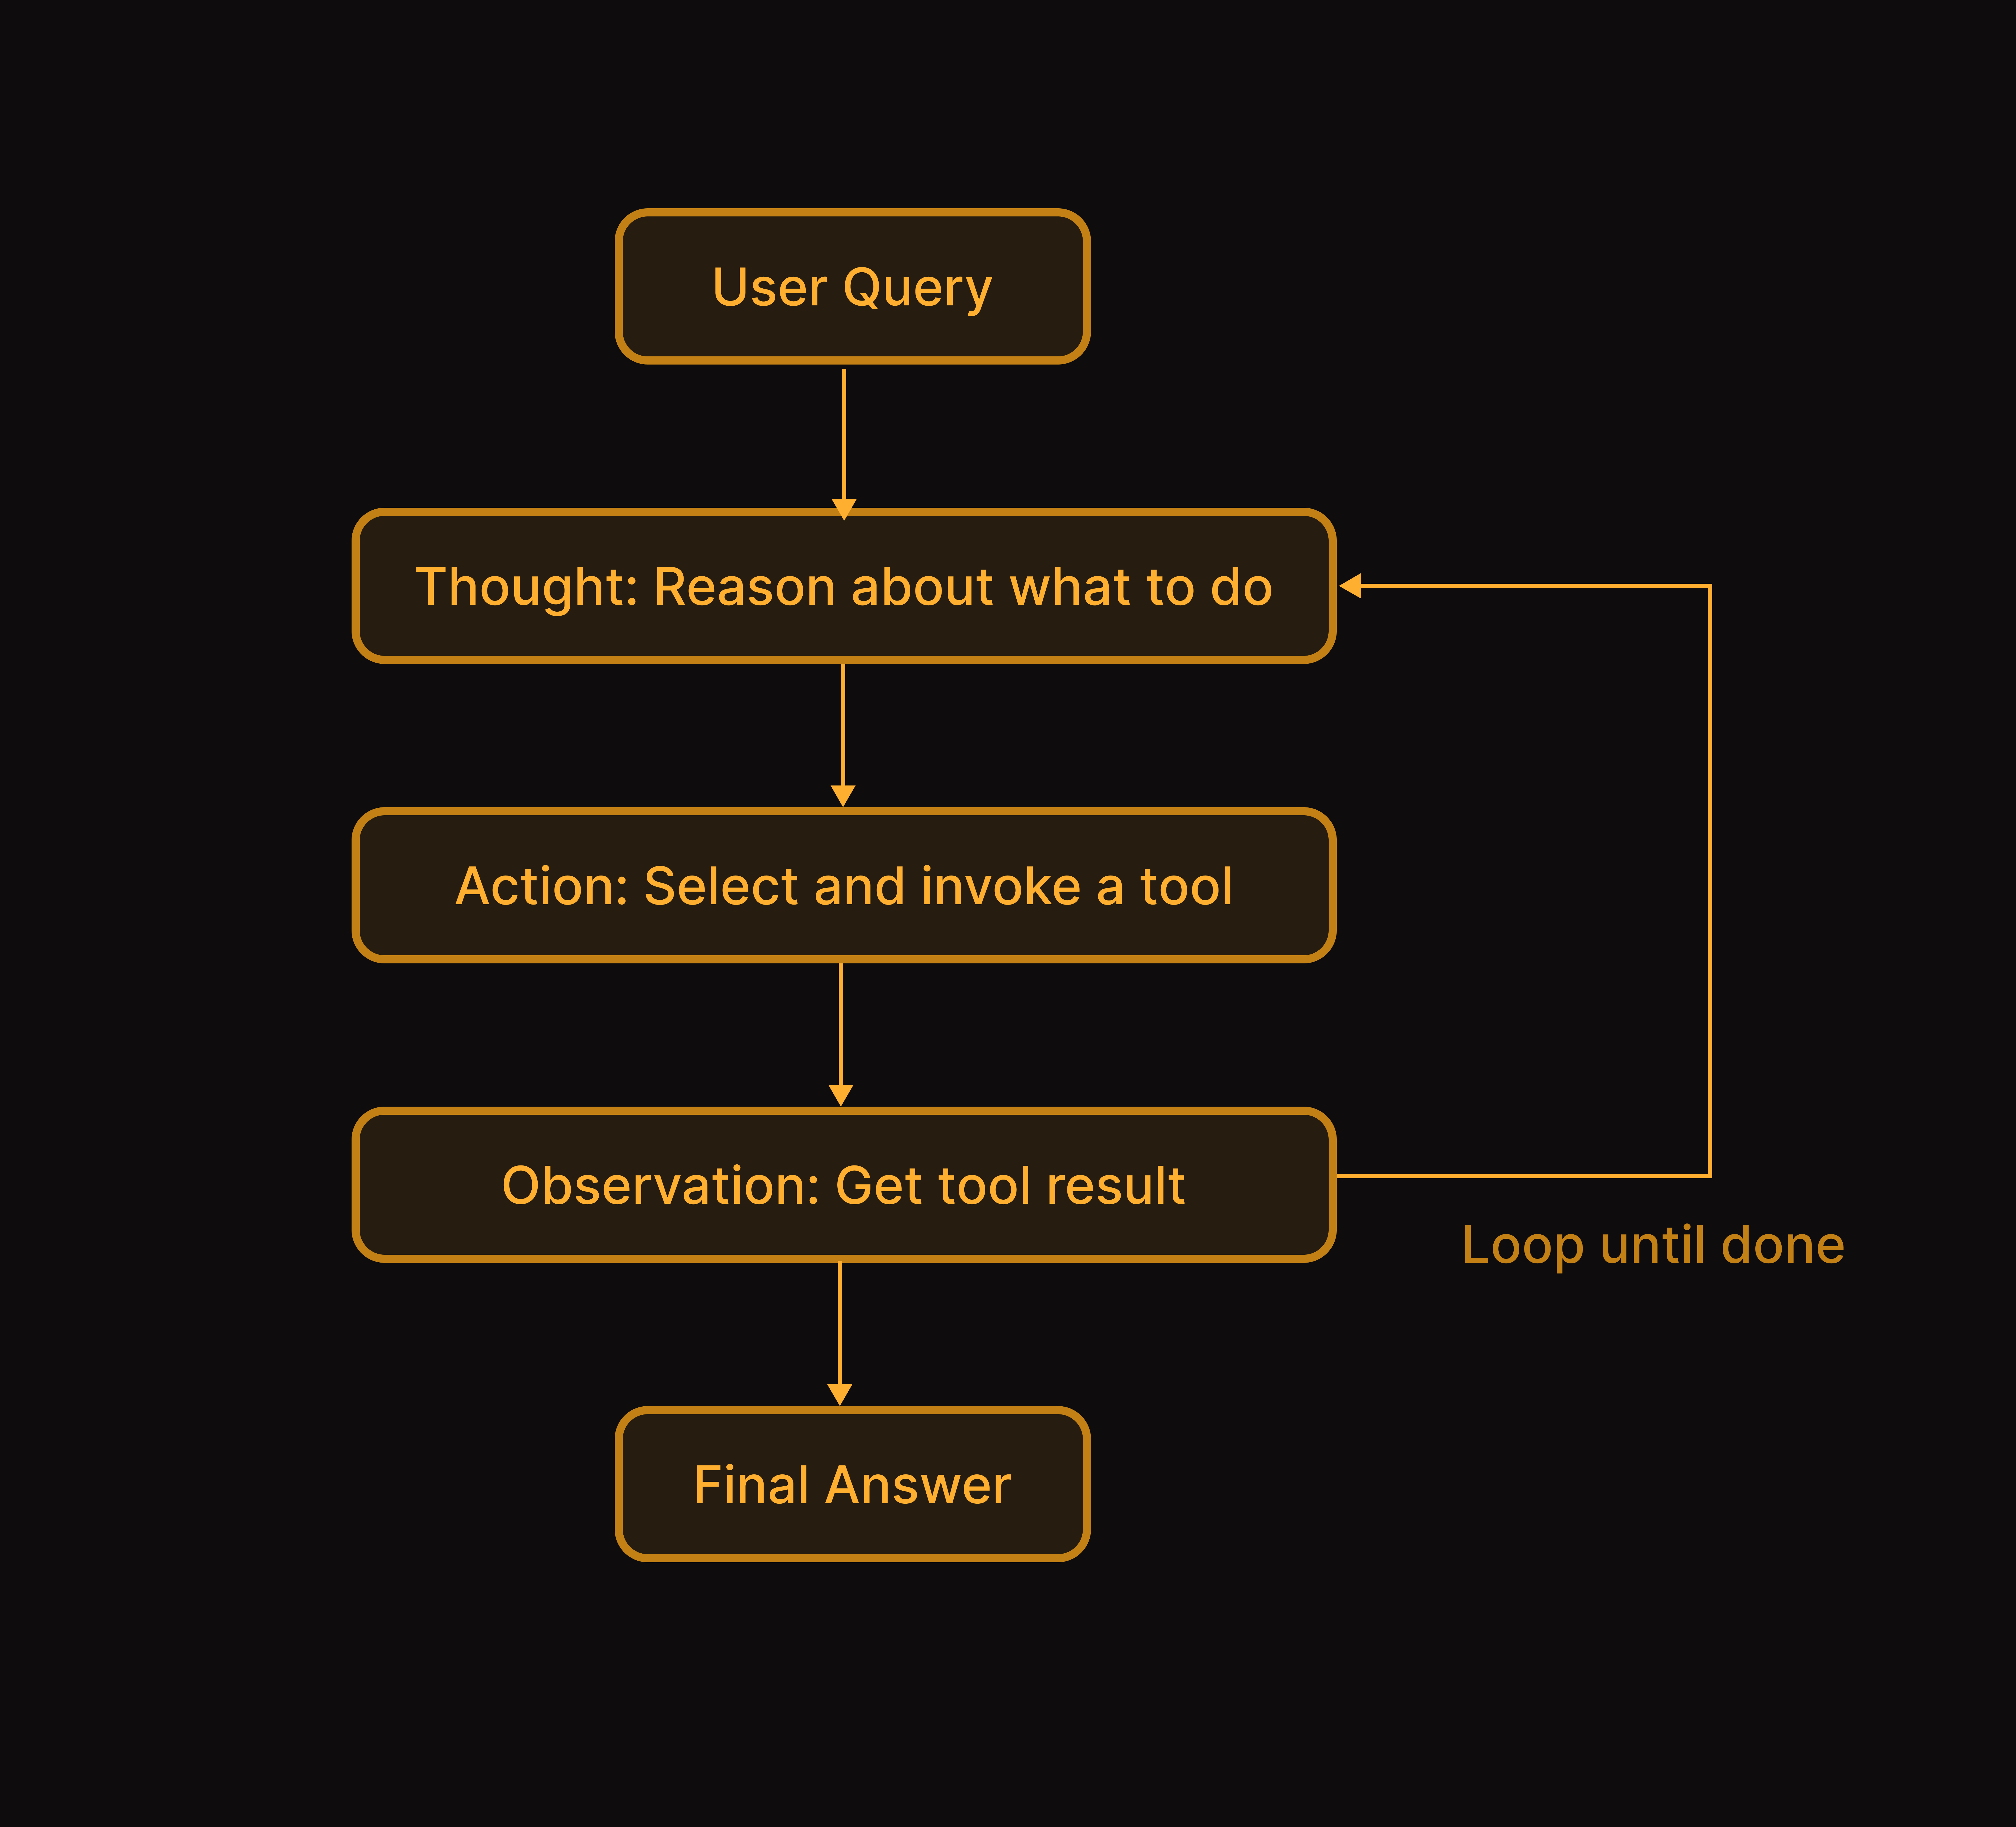
Building the Example Agent
Installation
Environment Setup
Mock Data and Tools
First, let’s define a simple agent with multiple tools:Create the Agent
Adding Netra Observability
Initialize Netra with Auto-Instrumentation
Netra provides auto-instrumentation for LangChain that captures agent execution automatically:- Agent execution spans
- LLM calls with prompts and completions
- Tool invocations with inputs and outputs
- Token usage and costs
Tracing Agent Execution with Decorators
For more control, wrap your agent handler with the@agent decorator:
Adding Custom Span Attributes
Enrich tool traces with custom attributes for better filtering and analysis:Running Sample Requests
Let’s test the agent with different query types to see tracing in action.Simple Query: FAQ Lookup
search_kb once and returns the policy information.
Order Status Query
check_order_status and provides tracking information.
Multi-Step Query
lookup_ticket to get context, then check_order_status to verify the order.
Escalation Scenario
escalate_to_human.
Viewing Traces in Netra
After running requests, navigate to Observability → Traces in Netra. You’ll see the full agent execution flow: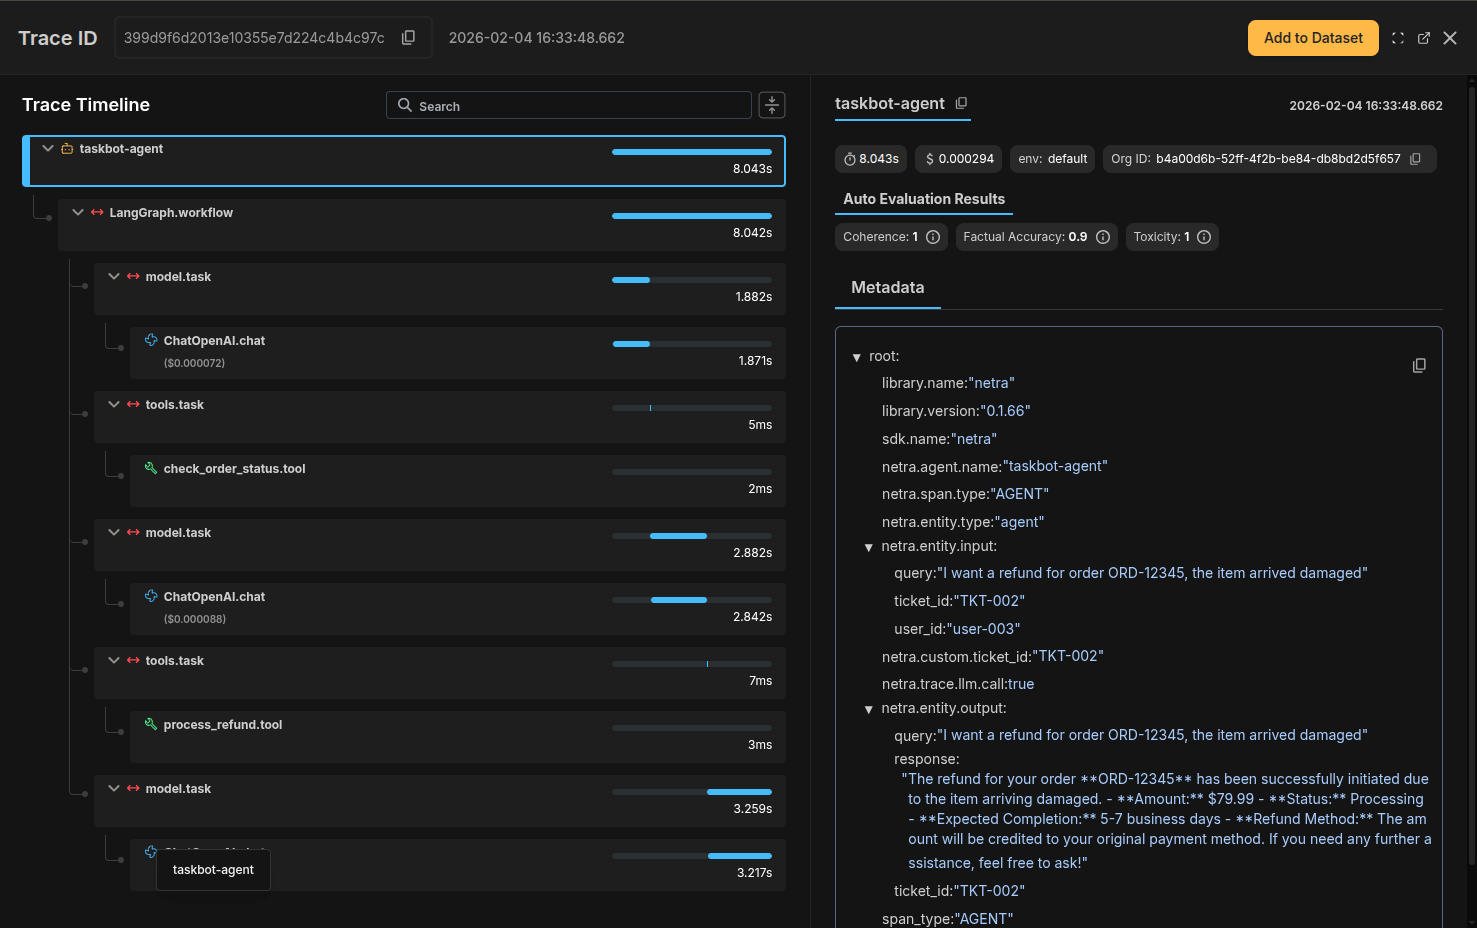
What the Trace Shows
- Parent span: The overall agent execution
- LLM calls: Each reasoning step with prompts and completions
- Tool calls: Each tool invocation with inputs, outputs, and latency
- Token usage: Cumulative token counts and costs
Filtering and Analysis
Use Netra’s filtering to analyze agent behavior:Summary
You’ve learned how to add comprehensive observability to LangChain agents:- Auto-instrumentation captures agent execution with minimal code
- Custom spans add business context to tool calls
- Trace analysis reveals reasoning patterns and failure modes
- Session tracking connects multi-turn conversations
Key Takeaways
- ReAct agents need visibility into the reasoning loop—trace each thought, action, and observation
- Tool call tracing reveals latency bottlenecks and decision patterns
- Custom attributes enable filtering by query type, user, and business context
- Session IDs connect related requests for conversation analysis
See Also
Evaluate Agent Decisions
Add systematic evaluation to measure tool selection accuracy
LangChain Integration
Complete LangChain instrumentation guide
Agents Documentation
Deep dive into agent observability features
Traces Overview
Understanding trace structure and analysis