> ## Documentation Index
> Fetch the complete documentation index at: https://docs.getnetra.ai/llms.txt
> Use this file to discover all available pages before exploring further.
# Comparing Traces
> Learn to compare AI traces side-by-side in Netra to debug regressions and analyze performance differences between prompt versions or model updates.
Trace comparison helps you understand why two executions of the same workflow produced different results, latencies, or costs. This is useful for debugging regressions, A/B testing prompts, and analyzing performance variations.
## When to Compare Traces
* **Debugging regressions** - Compare a failing trace with a successful one to spot differences
* **A/B testing** - Compare traces from different prompt versions or model configurations
* **Performance analysis** - Identify why some requests are slower than others
* **Cost optimization** - Compare token usage across different approaches
## Accessing Trace Comparison
1. Navigate to **Observability → Traces** in the Netra dashboard
2. Select the first trace you want to compare by clicking on it
3. Hold `Shift` and click on the second trace, or use the checkbox selection
4. Click the **Compare** button in the toolbar
 ## Understanding the Comparison View
The comparison view displays two traces side-by-side, making it easy to spot differences in execution flow, timing, and outcomes.
## Understanding the Comparison View
The comparison view displays two traces side-by-side, making it easy to spot differences in execution flow, timing, and outcomes.
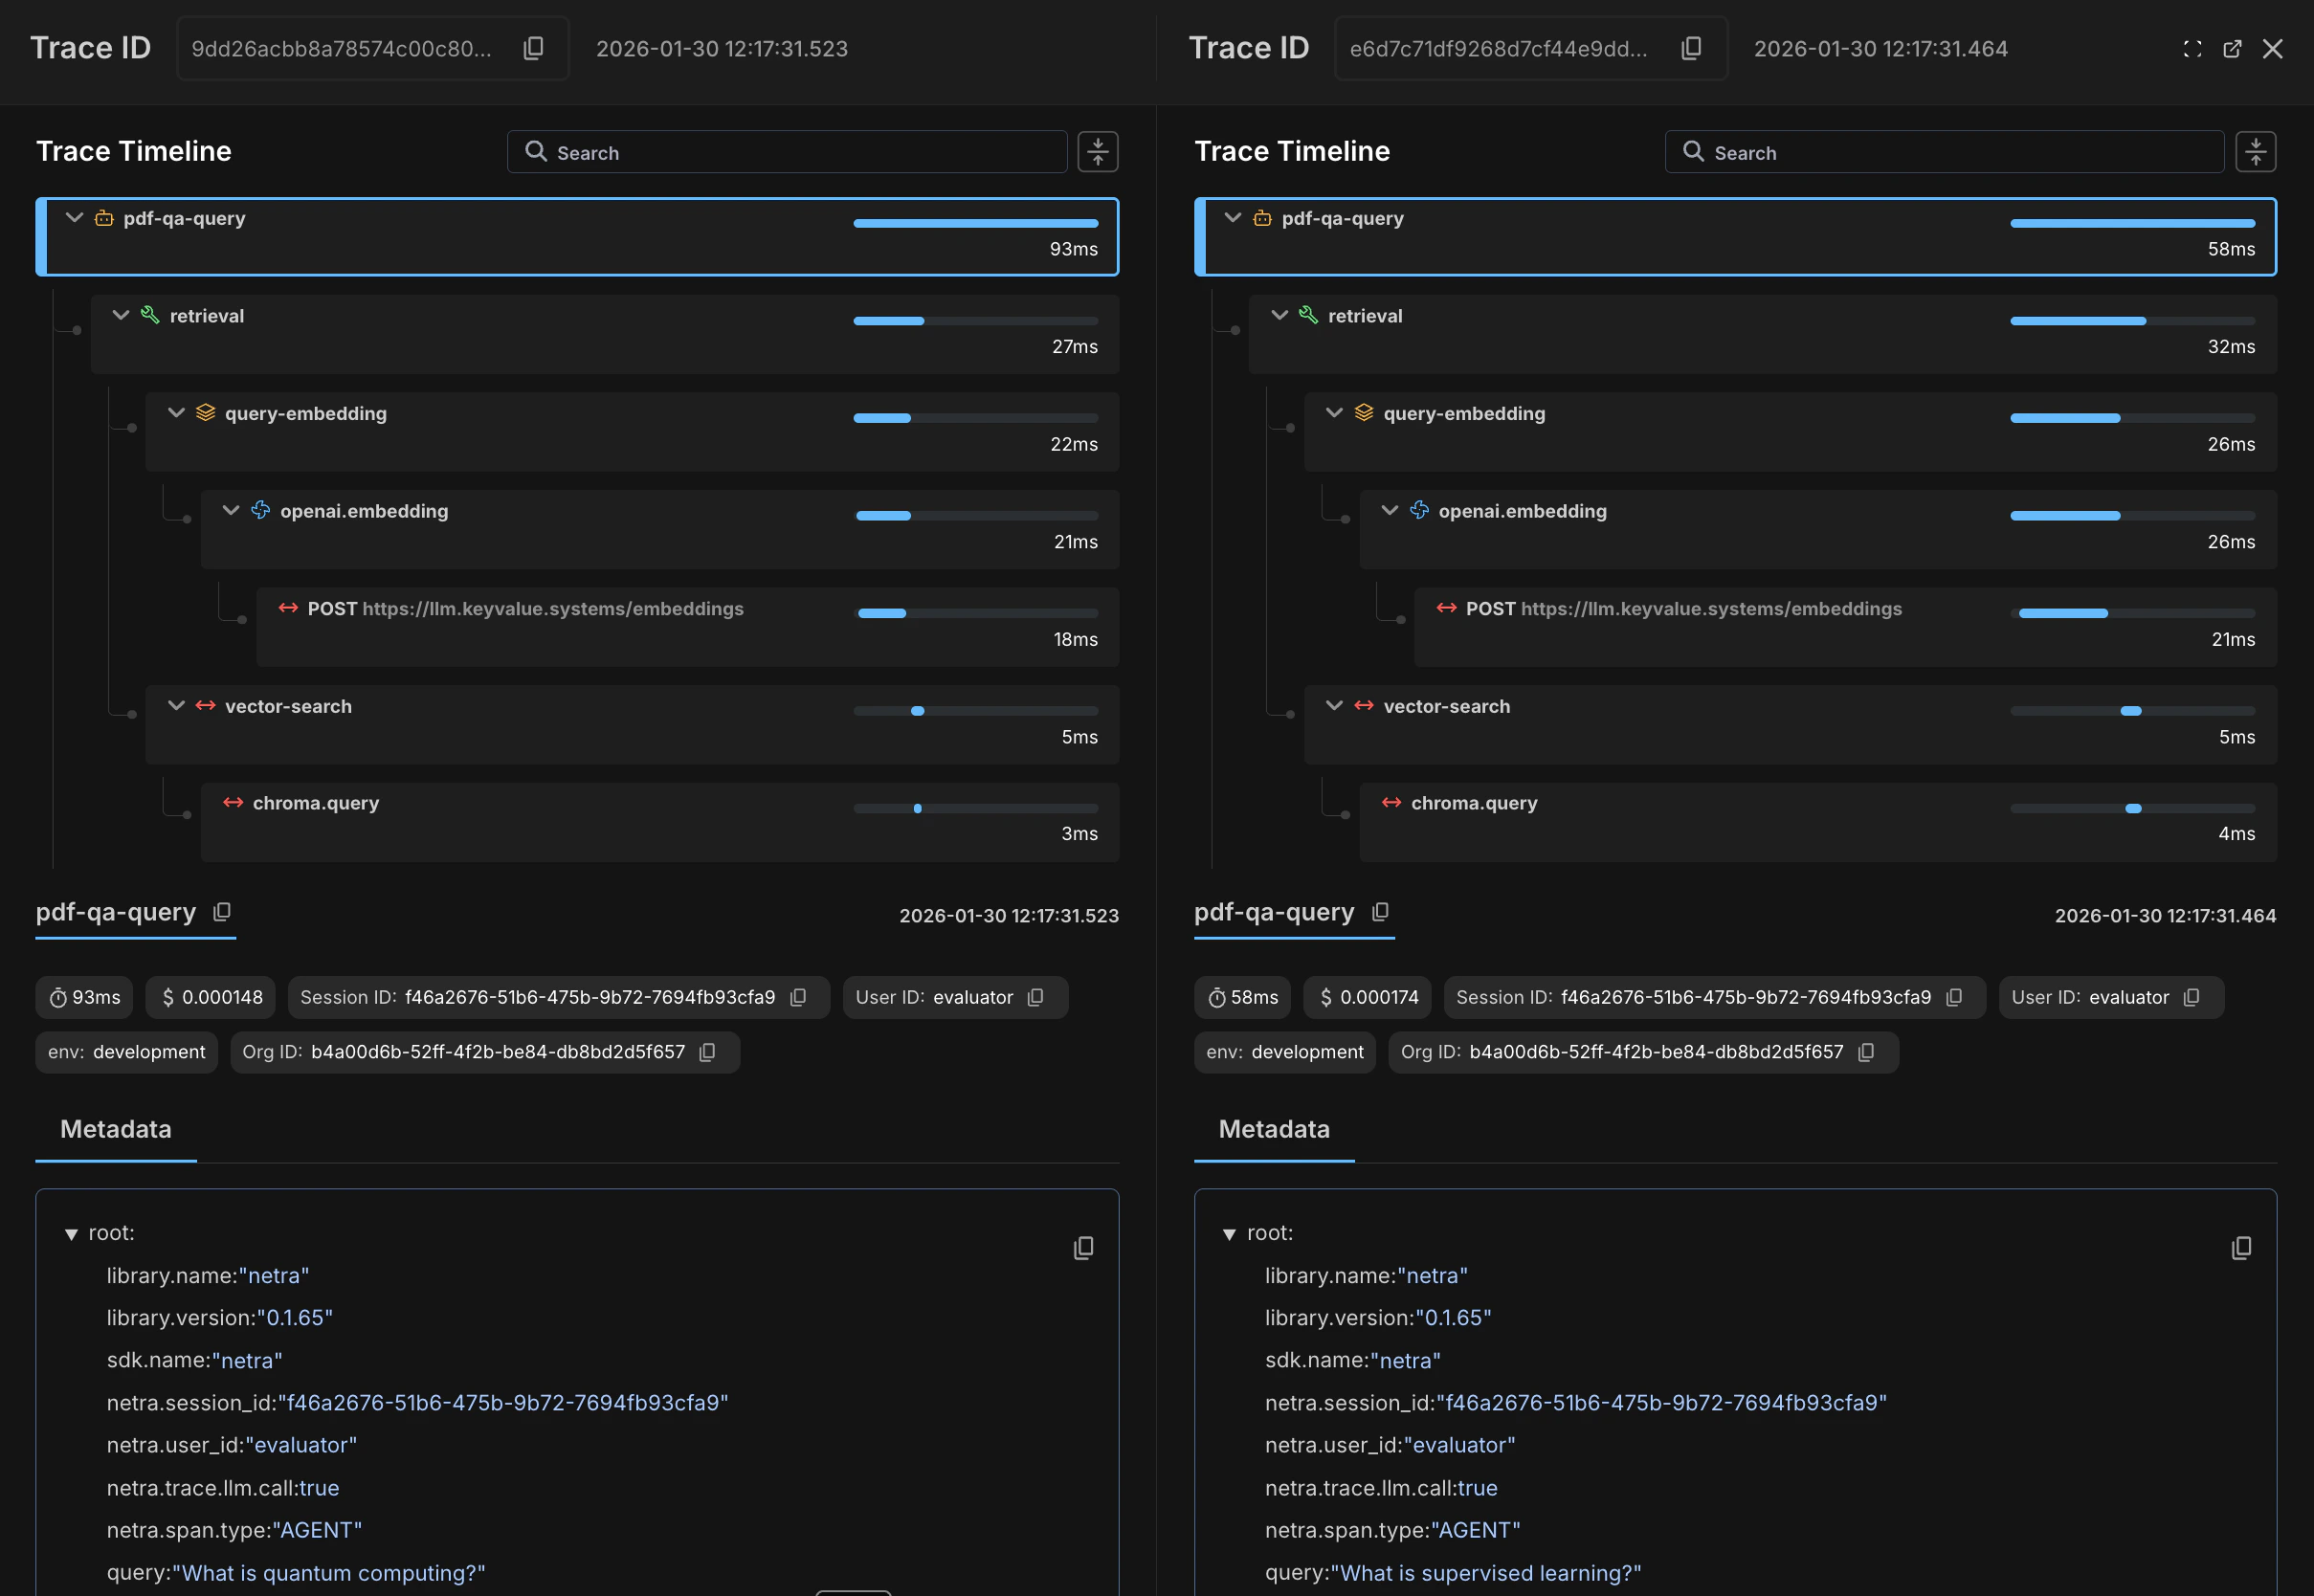 Each trace shows its complete timeline with expandable spans. You can see:
* **Trace ID and timestamp** at the top of each panel
* **Hierarchical span structure** showing the full execution flow (e.g., `pdf-qa-query` → `retrieval` → `query-embedding` → `openai.embedding`)
* **Duration for each span** displayed on the right side
* **Color coding** — error spans are shown in red, successfully executed spans in green
Click on any span to expand it and see its child spans. The **Metadata** panel below each timeline shows detailed attributes for the selected span — session ID, user ID, environment, HTTP details, instrumentation info, and any custom attributes you've added. For LLM calls, this also includes the full prompt and response content.
## Comparison Scenarios
### Scenario 1: Debugging a Slow Request
You notice some requests taking 5x longer than usual. Compare a slow trace with a fast one:
1. Filter traces by duration to find a slow example
2. Find a similar request with normal duration
3. Compare the two traces
**What to look for:**
* Spans that are significantly slower in one trace
* Additional spans in the slow trace (retry loops, fallbacks)
* Different code paths being executed
### Scenario 2: Comparing Prompt Versions
You've updated a prompt and want to verify the change:
1. Run both prompt versions with the same input
2. Capture the trace IDs or find them by timestamp
3. Compare the traces
**What to look for:**
* Token count differences (is the new prompt more efficient?)
* Response quality differences in the completion content
* Latency changes
### Scenario 3: Investigating Failures
A request that usually succeeds is now failing:
1. Find a recent failed trace
2. Find a recent successful trace for the same operation
3. Compare to identify the divergence point
**What to look for:**
* The span where the error occurred
* Input differences that might have caused the failure
* Missing or different API responses
## Tips for Effective Comparison
1. **Use consistent naming** - Ensure your spans have consistent names across traces so they align properly in comparison view.
2. **Add identifying attributes** - Include attributes like `request.id`, `user.id`, or `experiment.variant` to make traces easier to find and compare.
3. **Compare similar operations** - Comparing traces from completely different workflows won't be useful. Filter to the same operation type.
4. **Check timestamps** - Ensure you're comparing traces from similar time periods to avoid infrastructure differences.
## Exporting Comparison Data
To share comparison results with your team:
1. Click **Export** in the comparison view
2. Choose your format:
* **PDF** - Visual report with timeline and metrics
* **JSON** - Raw data for programmatic analysis
3. The export includes both traces and highlighted differences
## Next Steps
* [Custom Trace Views](/Tutorials/custom-trace-views) - Create saved views to quickly find traces for comparison
* [Traces Overview](/Observability/Traces/overview) - Learn more about traces and spans
Each trace shows its complete timeline with expandable spans. You can see:
* **Trace ID and timestamp** at the top of each panel
* **Hierarchical span structure** showing the full execution flow (e.g., `pdf-qa-query` → `retrieval` → `query-embedding` → `openai.embedding`)
* **Duration for each span** displayed on the right side
* **Color coding** — error spans are shown in red, successfully executed spans in green
Click on any span to expand it and see its child spans. The **Metadata** panel below each timeline shows detailed attributes for the selected span — session ID, user ID, environment, HTTP details, instrumentation info, and any custom attributes you've added. For LLM calls, this also includes the full prompt and response content.
## Comparison Scenarios
### Scenario 1: Debugging a Slow Request
You notice some requests taking 5x longer than usual. Compare a slow trace with a fast one:
1. Filter traces by duration to find a slow example
2. Find a similar request with normal duration
3. Compare the two traces
**What to look for:**
* Spans that are significantly slower in one trace
* Additional spans in the slow trace (retry loops, fallbacks)
* Different code paths being executed
### Scenario 2: Comparing Prompt Versions
You've updated a prompt and want to verify the change:
1. Run both prompt versions with the same input
2. Capture the trace IDs or find them by timestamp
3. Compare the traces
**What to look for:**
* Token count differences (is the new prompt more efficient?)
* Response quality differences in the completion content
* Latency changes
### Scenario 3: Investigating Failures
A request that usually succeeds is now failing:
1. Find a recent failed trace
2. Find a recent successful trace for the same operation
3. Compare to identify the divergence point
**What to look for:**
* The span where the error occurred
* Input differences that might have caused the failure
* Missing or different API responses
## Tips for Effective Comparison
1. **Use consistent naming** - Ensure your spans have consistent names across traces so they align properly in comparison view.
2. **Add identifying attributes** - Include attributes like `request.id`, `user.id`, or `experiment.variant` to make traces easier to find and compare.
3. **Compare similar operations** - Comparing traces from completely different workflows won't be useful. Filter to the same operation type.
4. **Check timestamps** - Ensure you're comparing traces from similar time periods to avoid infrastructure differences.
## Exporting Comparison Data
To share comparison results with your team:
1. Click **Export** in the comparison view
2. Choose your format:
* **PDF** - Visual report with timeline and metrics
* **JSON** - Raw data for programmatic analysis
3. The export includes both traces and highlighted differences
## Next Steps
* [Custom Trace Views](/Tutorials/custom-trace-views) - Create saved views to quickly find traces for comparison
* [Traces Overview](/Observability/Traces/overview) - Learn more about traces and spans