> ## Documentation Index
> Fetch the complete documentation index at: https://docs.getnetra.ai/llms.txt
> Use this file to discover all available pages before exploring further.
# Test Runs
> View Netra simulation test run results with full conversation transcripts. Analyze turn-by-turn scores, agent behavior, and goal completion rates for text and voice.
Test Runs for simulations show the execution results of your [simulations](/Simulations/text-simulations/Simulations). Each run provides a complete conversation transcript between the simulated user and your agent—along with evaluation results, scenario details, and performance metrics. Voice runs additionally include the full audio recording synced to the transcript.
## Why Simulation Test Runs Matter
Simulation test runs provide deep insights into conversational agent performance:
| Capability | Benefit |
| ---------------------------- | ---------------------------------------------------------------------------------------------- |
| **Conversation Transcripts** | See the full multi-turn dialogue to understand how your agent performed |
| **Scenario Details** | View goal, persona, user data, and provider configuration |
| **Turn-by-Turn Tracing** | Jump directly to execution [traces](/Observability/Traces/overview) for each conversation turn |
| **Evaluation Results** | Review turn-level and session-level evaluator scores |
| **Exit Reason Tracking** | Understand why conversations ended (goal achieved, failed, abandoned, max turns) |
| **Aggregated Metrics** | Monitor cost, latency, and success rates across simulations |
| **Synced Audio Playback** | For voice runs, listen to the actual call while following the transcript |
## Test Runs Dashboard
Navigate to **Evaluate → Test Runs** from the left navigation panel to see simulation test runs.
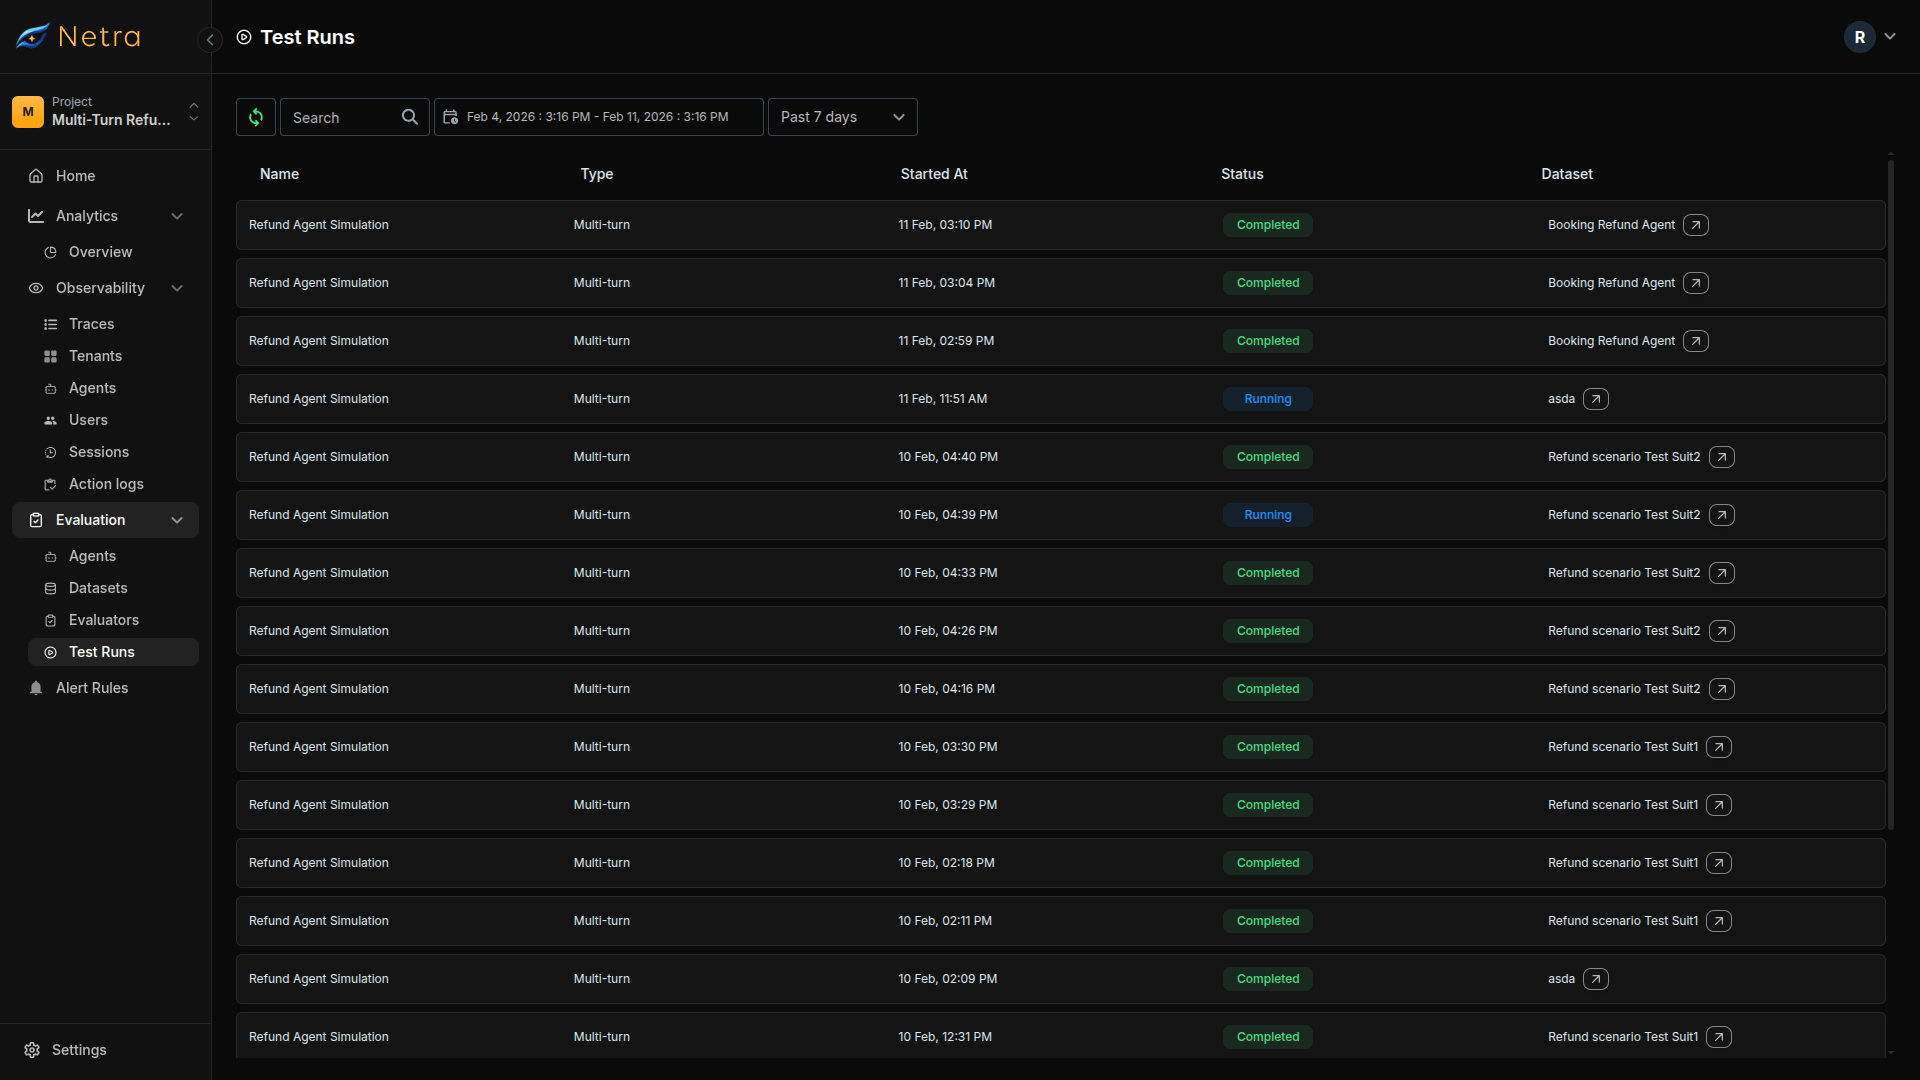 | Column | Description |
| -------------- | ----------------------------------------------------------------------------- |
| **Name** | Name of the test run |
| **Turn Type** | Multi-turn for simulation test runs |
| **Created** | Timestamp when the simulation began |
| **Status** | Current state: Completed, Running, or Failed |
| **Evaluation** | Pass/fail summary across evaluators |
| **Simulation** | The [simulation](/Simulations/text-simulations/Simulations) used for this run |
### Filtering and Search
* **Date Range**: Filter runs by time period to compare performance over time
* **Search**: Find specific test runs by name or simulation
* **Filters**: Narrow by run status or simulation
### Comparing Runs
Select two or more completed runs of the same simulation using the checkboxes and click **Compare**. The comparison view aligns scenarios across runs and shows:
| Metric | What You See |
| ------------------- | --------------------------------------------------------------- |
| **Pass Rate** | Overall pass percentage per run, with deltas against a base run |
| **Average Score** | Mean normalized score across evaluators |
| **Total Cost** | Aggregate evaluation cost |
| **Duration** | End-to-end run time |
| **Average Latency** | Mean response time |
Each evaluator gets a verdict cell per scenario, so you can see exactly which scenarios flipped from pass to fail between runs.
## Viewing Test Run Details
Click on any simulation test run to access detailed results.
| Column | Description |
| -------------- | ----------------------------------------------------------------------------- |
| **Name** | Name of the test run |
| **Turn Type** | Multi-turn for simulation test runs |
| **Created** | Timestamp when the simulation began |
| **Status** | Current state: Completed, Running, or Failed |
| **Evaluation** | Pass/fail summary across evaluators |
| **Simulation** | The [simulation](/Simulations/text-simulations/Simulations) used for this run |
### Filtering and Search
* **Date Range**: Filter runs by time period to compare performance over time
* **Search**: Find specific test runs by name or simulation
* **Filters**: Narrow by run status or simulation
### Comparing Runs
Select two or more completed runs of the same simulation using the checkboxes and click **Compare**. The comparison view aligns scenarios across runs and shows:
| Metric | What You See |
| ------------------- | --------------------------------------------------------------- |
| **Pass Rate** | Overall pass percentage per run, with deltas against a base run |
| **Average Score** | Mean normalized score across evaluators |
| **Total Cost** | Aggregate evaluation cost |
| **Duration** | End-to-end run time |
| **Average Latency** | Mean response time |
Each evaluator gets a verdict cell per scenario, so you can see exactly which scenarios flipped from pass to fail between runs.
## Viewing Test Run Details
Click on any simulation test run to access detailed results.
 ### Summary Metrics
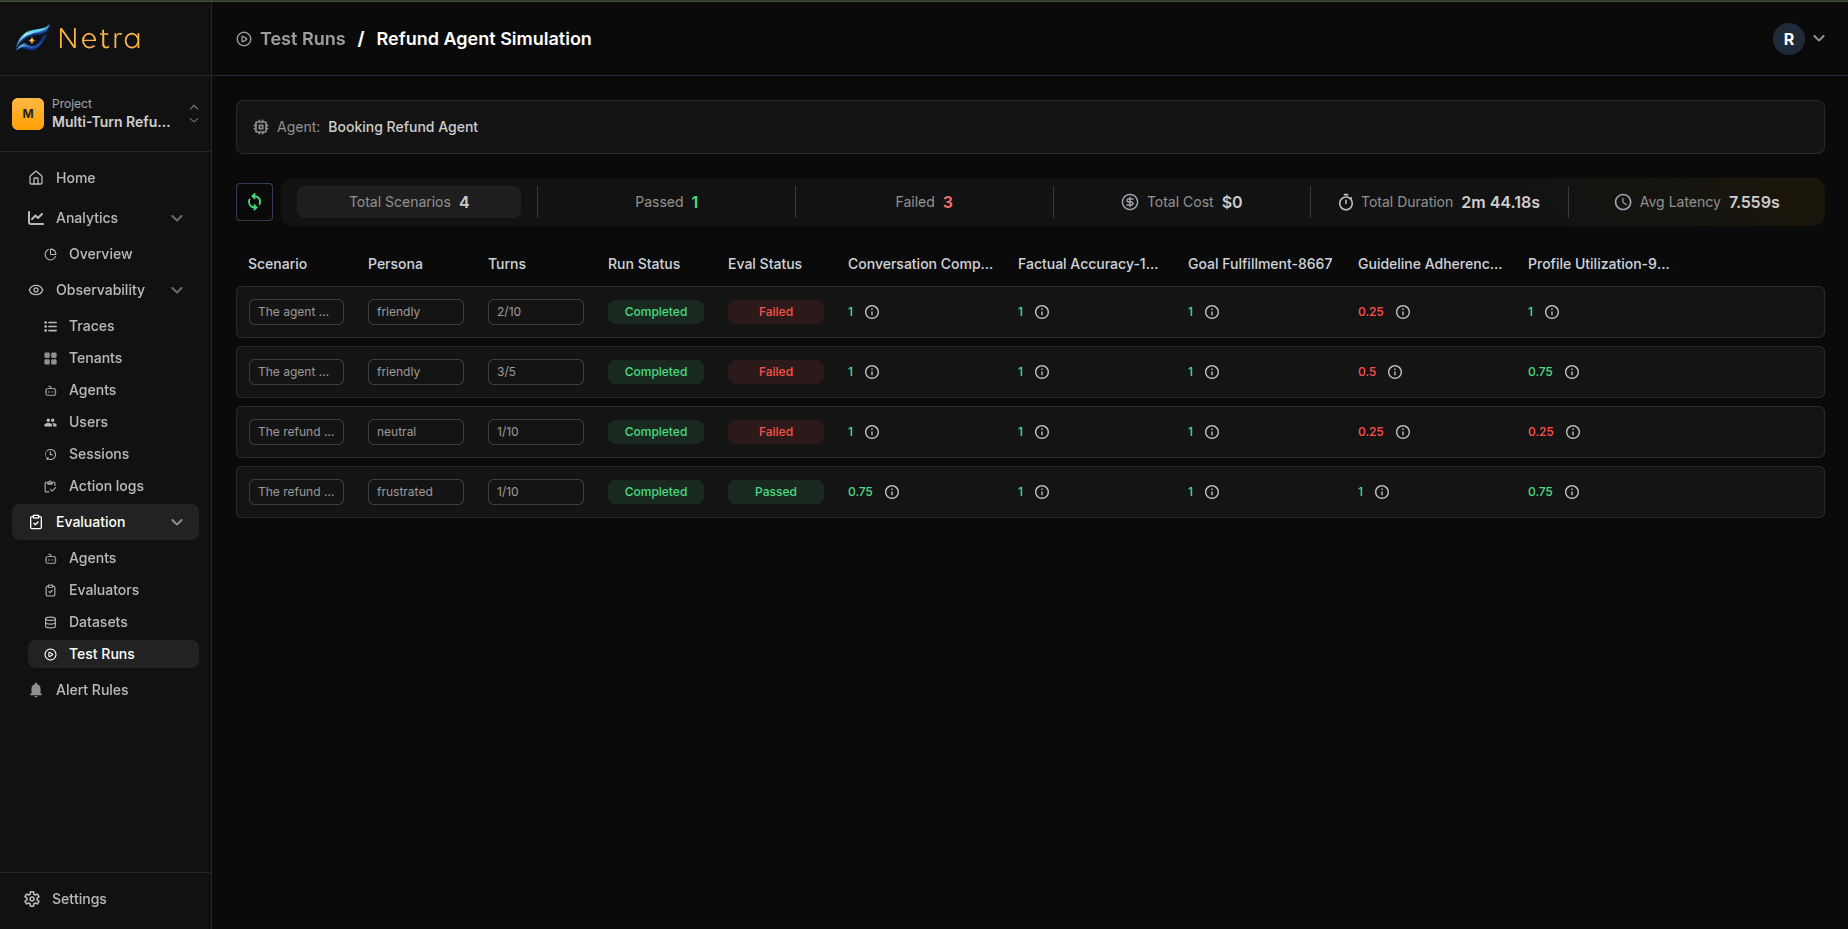
The top of the detail view shows aggregated performance data:
| Metric | Description |
| ------------------- | --------------------------------------------- |
| **Total Scenarios** | Number of scenarios run in this test |
| **Passed** | Count of scenarios that achieved their goals |
| **Failed** | Count of scenarios that did not achieve goals |
| **Total Cost** | Aggregate token/API cost for all scenarios |
| **Total Duration** | End-to-end time for the simulation run |
| **Average Latency** | Mean response time across all turns |
Click the **Total**, **Passed**, or **Failed** counters to filter the scenario list below.
## Viewing Scenario Details
Click on any test run item to view the detailed scenario results. This opens a modal with three tabs.
The items table lists every scenario with dynamically generated columns—one per configured evaluator—alongside Scenario Name, Scenario, Persona, Turns, Run Status, Eval Status, and a link to the execution [trace](/Observability/Traces/overview). Click any row to open the scenario details.
### Tab 1: Conversation
The Conversation tab shows the full multi-turn dialogue between the simulated user and your agent.
### Summary Metrics
The top of the detail view shows aggregated performance data:
| Metric | Description |
| ------------------- | --------------------------------------------- |
| **Total Scenarios** | Number of scenarios run in this test |
| **Passed** | Count of scenarios that achieved their goals |
| **Failed** | Count of scenarios that did not achieve goals |
| **Total Cost** | Aggregate token/API cost for all scenarios |
| **Total Duration** | End-to-end time for the simulation run |
| **Average Latency** | Mean response time across all turns |
Click the **Total**, **Passed**, or **Failed** counters to filter the scenario list below.
## Viewing Scenario Details
Click on any test run item to view the detailed scenario results. This opens a modal with three tabs.
The items table lists every scenario with dynamically generated columns—one per configured evaluator—alongside Scenario Name, Scenario, Persona, Turns, Run Status, Eval Status, and a link to the execution [trace](/Observability/Traces/overview). Click any row to open the scenario details.
### Tab 1: Conversation
The Conversation tab shows the full multi-turn dialogue between the simulated user and your agent.
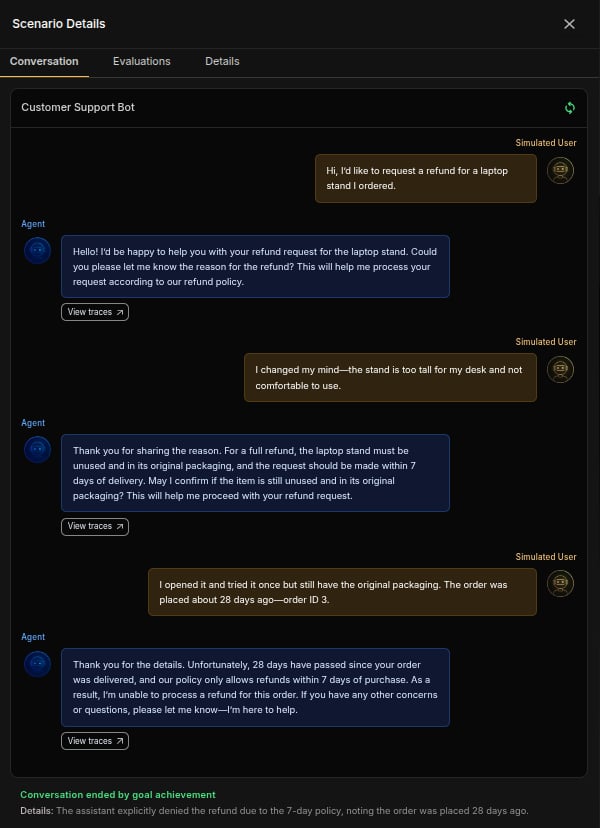 **Features**:
* **Turn-by-Turn Display**: Each conversation turn is clearly separated
* **User Messages**: Shows what the simulated user said
* **Agent Responses**: Shows what your agent replied
* **Live Updates**: While a simulation is running, new turns stream in as they happen
* **Per-Turn Metrics**: Each message shows its cost, latency, and token usage
* **Tool Calls**: Tool invocations are shown as badges on the turns that used them
* **Trace Links**: Click **View Trace** to see detailed execution traces
* **Exit Reason**: A banner explains why the conversation ended
* **Lifecycle Hooks**: If hooks were configured for the run, their outputs are shown alongside the transcript
#### Voice Runs: Synced Audio Playback
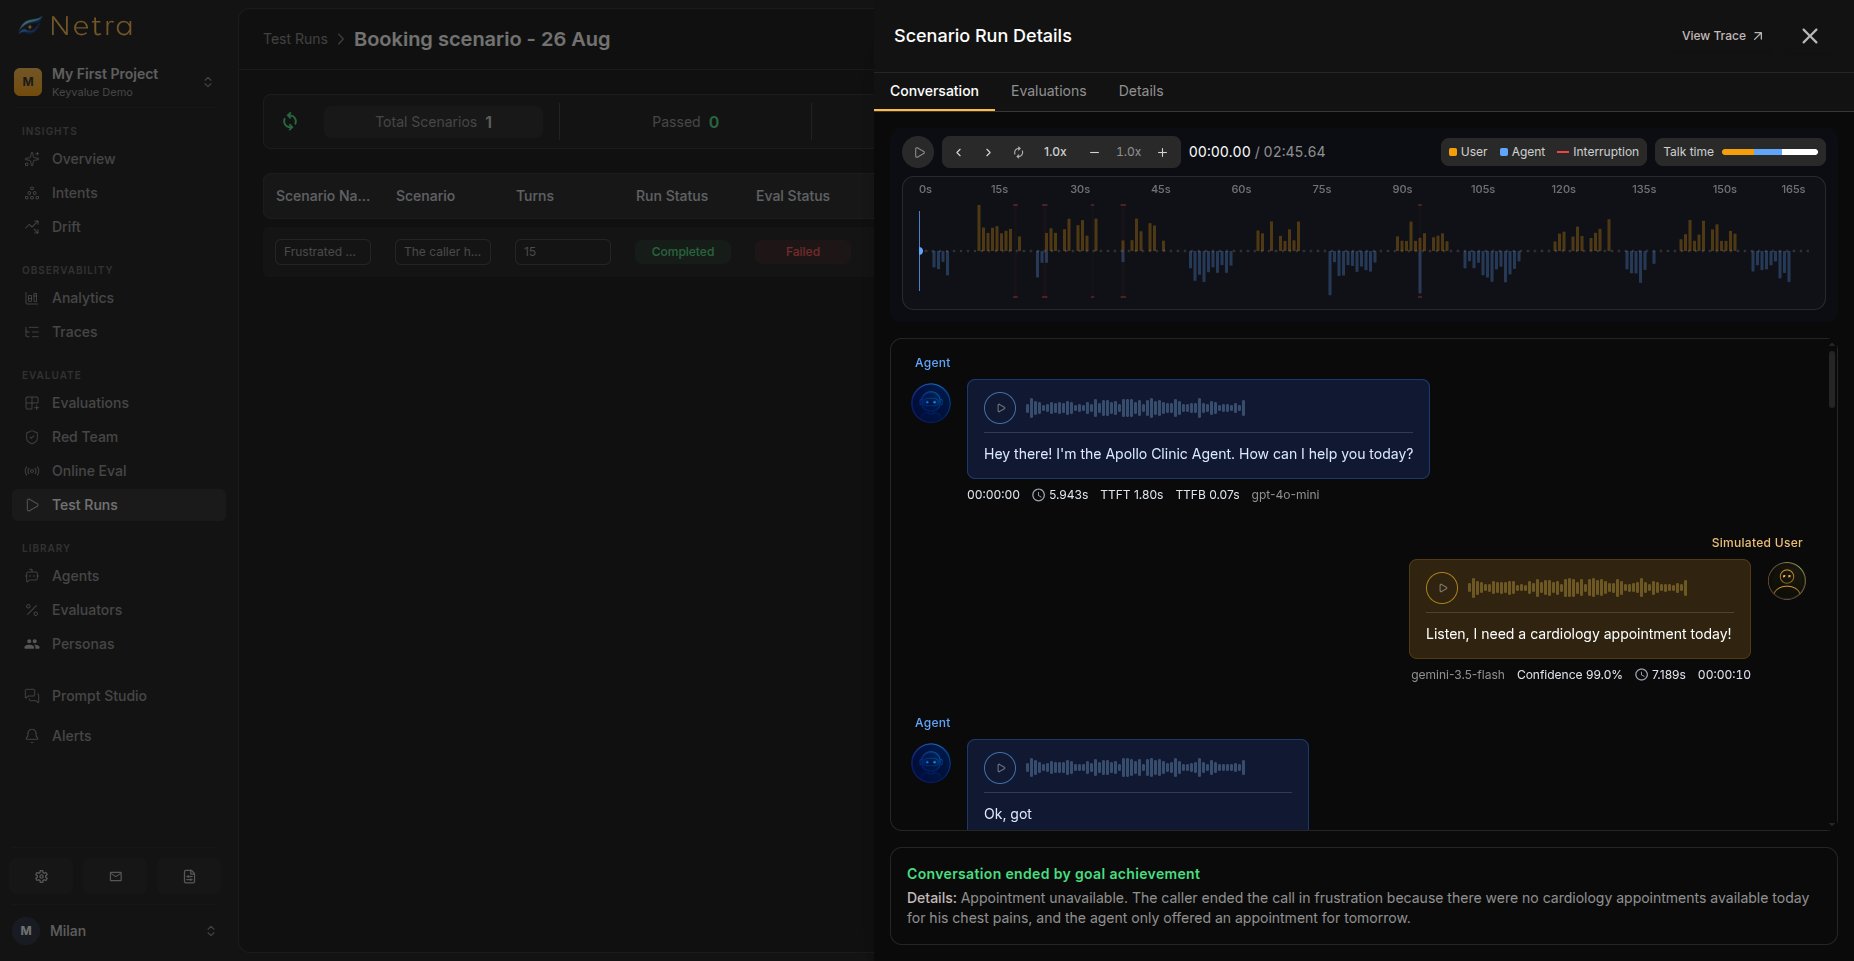
For voice simulations, the Conversation tab pairs the transcript with an audio player:
* **Session Audio**: Play the full stereo recording of the call
* **Transcript Sync**: The transcript highlights as playback progresses; click any message to jump to that moment
* **Per-Turn Snippets**: Replay individual caller or agent turns
**Features**:
* **Turn-by-Turn Display**: Each conversation turn is clearly separated
* **User Messages**: Shows what the simulated user said
* **Agent Responses**: Shows what your agent replied
* **Live Updates**: While a simulation is running, new turns stream in as they happen
* **Per-Turn Metrics**: Each message shows its cost, latency, and token usage
* **Tool Calls**: Tool invocations are shown as badges on the turns that used them
* **Trace Links**: Click **View Trace** to see detailed execution traces
* **Exit Reason**: A banner explains why the conversation ended
* **Lifecycle Hooks**: If hooks were configured for the run, their outputs are shown alongside the transcript
#### Voice Runs: Synced Audio Playback
For voice simulations, the Conversation tab pairs the transcript with an audio player:
* **Session Audio**: Play the full stereo recording of the call
* **Transcript Sync**: The transcript highlights as playback progresses; click any message to jump to that moment
* **Per-Turn Snippets**: Replay individual caller or agent turns
 **Exit Statuses**:
| Exit Status | Description |
| ------------------------ | ----------------------------------------------------- |
| **Goal Achieved** | The scenario objective was successfully completed |
| **In Progress** | The conversation is still running |
| **Failed** | The objective could not be achieved |
| **Abandoned** | The simulated user gave up or stopped engaging |
| **Agent Left** | Your agent ended or dropped the call (voice only) |
| **Max Turns Reached** | The turn limit was hit before completion |
| **Max Duration Reached** | The time limit was hit before completion (voice only) |
| **Silence** | The call timed out due to silence (voice only) |
| **Error** | A pipeline failure ended the call |
Conversations also end when the max turns limit is reached.
Use the **View Trace** link to debug specific turns where the agent's response
was unexpected or incorrect. Traces show the full LLM call, tool usage, and
latency breakdown.
### Tab 2: Evaluation Results
The Evaluation Results tab shows one card per configured [evaluator](/Evaluators/text-evaluators).
**Exit Statuses**:
| Exit Status | Description |
| ------------------------ | ----------------------------------------------------- |
| **Goal Achieved** | The scenario objective was successfully completed |
| **In Progress** | The conversation is still running |
| **Failed** | The objective could not be achieved |
| **Abandoned** | The simulated user gave up or stopped engaging |
| **Agent Left** | Your agent ended or dropped the call (voice only) |
| **Max Turns Reached** | The turn limit was hit before completion |
| **Max Duration Reached** | The time limit was hit before completion (voice only) |
| **Silence** | The call timed out due to silence (voice only) |
| **Error** | A pipeline failure ended the call |
Conversations also end when the max turns limit is reached.
Use the **View Trace** link to debug specific turns where the agent's response
was unexpected or incorrect. Traces show the full LLM call, tool usage, and
latency breakdown.
### Tab 2: Evaluation Results
The Evaluation Results tab shows one card per configured [evaluator](/Evaluators/text-evaluators).
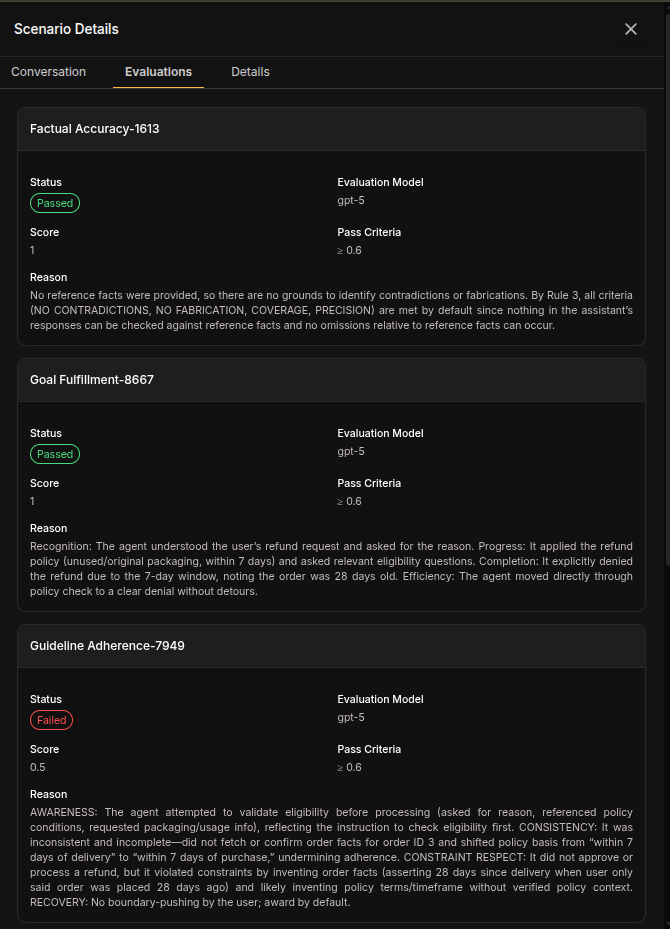 Each card includes:
| Field | Description |
| ----------------------- | --------------------------------------------------------------------------------------------- |
| **Verdict** | Pass or Fail badge based on the evaluator's configured pass criteria |
| **Score** | The normalized score (0-1) this evaluator assigned |
| **Evaluation Model** | The judge model that produced the score |
| **Reason** | The judge's explanation, citing evidence from the conversation |
| **Failed Turns** | For failed evaluations, the specific turns at fault with deep links into the Conversation tab |
| **Evaluated Variables** | Expandable view of the exact inputs the evaluator received |
Pass criteria are per-evaluator—each evaluator applies its own configured threshold.
**Example Results**:
| Evaluator | Score | Verdict |
| ------------------------- | ----- | ------- |
| Goal Fulfillment | 1 | Pass |
| Factual Accuracy | 1 | Pass |
| Conversation Completeness | 1 | Pass |
| Guideline Adherence | 0.5 | Fail |
### Tab 3: Scenario Details
The Scenario Details tab shows the complete configuration used for this simulation.
Each card includes:
| Field | Description |
| ----------------------- | --------------------------------------------------------------------------------------------- |
| **Verdict** | Pass or Fail badge based on the evaluator's configured pass criteria |
| **Score** | The normalized score (0-1) this evaluator assigned |
| **Evaluation Model** | The judge model that produced the score |
| **Reason** | The judge's explanation, citing evidence from the conversation |
| **Failed Turns** | For failed evaluations, the specific turns at fault with deep links into the Conversation tab |
| **Evaluated Variables** | Expandable view of the exact inputs the evaluator received |
Pass criteria are per-evaluator—each evaluator applies its own configured threshold.
**Example Results**:
| Evaluator | Score | Verdict |
| ------------------------- | ----- | ------- |
| Goal Fulfillment | 1 | Pass |
| Factual Accuracy | 1 | Pass |
| Conversation Completeness | 1 | Pass |
| Guideline Adherence | 0.5 | Fail |
### Tab 3: Scenario Details
The Scenario Details tab shows the complete configuration used for this simulation.
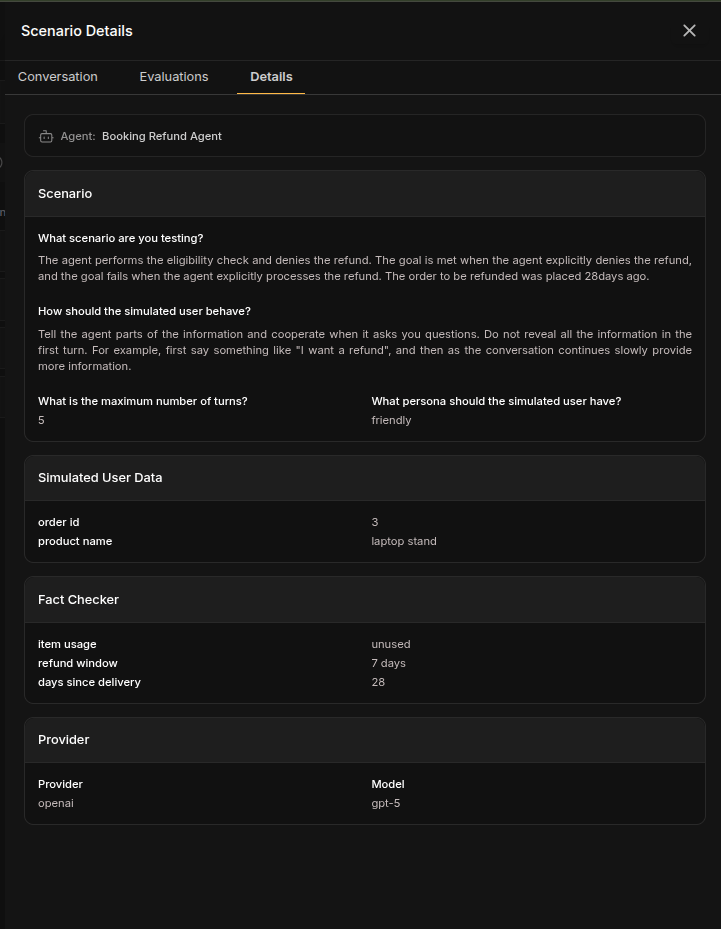 **Scenario Section**:
| Field | Value |
| ---------------- | ------------------------------------------------------------------- |
| **Goal** | The scenario objective (e.g., "Get a refund for a damaged product") |
| **Max Turns** | Maximum turns allowed (e.g., 5) |
| **User Persona** | The persona used (e.g., Frustrated) |
**User Data Section**:
Shows all context data provided to the simulated user:
```json theme={null}
{
"order id": "3",
"product name": "laptop stand"
}
```
**Fact Checker Section**:
Shows facts the agent needed to communicate:
```json theme={null}
{
"item usage": "unused",
"refund window": "7 days",
"days since delivery": "28"
}
```
**Provider Configuration Section**:
| Field | Value |
| ------------ | --------------------------------------------- |
| **Provider** | The LLM provider used (e.g., openai) |
| **Model** | The model used for simulation (e.g., gpt-4.1) |
For voice simulations, the provider section additionally shows the STT, reasoning LLM, and TTS stages configured for the call.
The Scenario Details tab is crucial for understanding the context of each
simulation. It shows exactly what data the simulated user had access to and
what facts the agent was expected to communicate.
## Analyzing Simulation Results
### Identifying Patterns
When reviewing simulation test runs, look for:
* **Goal achievement rates**: What percentage of simulations achieved their goals?
* **Persona differences**: Does your agent perform better with certain personas? Run the same scenarios with all persona types and compare results.
* **Turn efficiency**: Are conversations longer than necessary? Compare turn counts for successful vs failed scenarios.
* **Common failure points**: Which turns typically cause issues?
* **Fact accuracy**: Are specific facts consistently missed?
* **Cost trends**: Monitor total cost across test runs and identify scenarios that consume excessive turns.
### Voice-Specific Analysis
When reviewing voice simulation test runs, also look for:
* **Transcription failures**: High Word Error Rate on noisy scenarios suggests your STT stage needs tuning
* **Unnatural delivery**: Low Humanness or Expressiveness scores point at TTS voice choice or prompt phrasing
* **Slow first responses**: Time to First Transcript failures make calls feel laggy — check your streaming configuration
* **Talking over callers**: Backchannelling Naturalness failures reveal agents that cut users off
* **Unbalanced dialogue**: Speaking Percentage outside the healthy range means your agent dominates or under-participates
### Debugging Failed Simulations
For each failed scenario:
1. **Review the Conversation tab**: Identify where the conversation went wrong
2. **Check the Evaluation Results tab**: See which evaluators failed and why
3. **Examine the Scenario Details tab**: Verify the user data and facts were correct
4. **Click View Trace**: Inspect the full execution flow for problematic turns — check LLM inputs, tool calls, and latency breakdowns
### Comparing Across Runs
To track improvement or regression:
1. Run simulations after each agent update
2. Use the built-in [Compare view](#comparing-runs) for side-by-side deltas across runs
3. Investigate scenarios that changed from pass to fail
4. Track turn efficiency and cost trends over time
## Best Practices
* **Test after every agent change**: Run simulations when updating your agent to catch regressions early
* **Create baseline runs**: Establish performance benchmarks before making changes
* **Always check traces for failures**: Don't just read the conversation — inspect the execution flow, LLM context, and tool calls
* **Review latency**: Identify slow turns that might frustrate real users
* **Listen before you read** (voice): Audio context often explains scores that look wrong on paper
* **Run noisy variants** (voice): Once calls pass in quiet conditions, re-run with background noise enabled
* **Compare across pipeline changes** (voice): Use run comparison whenever you switch STT/TTS providers
* **Watch latency early** (voice): TTFT problems compound — fix them before tuning content quality
## Related
* [Simulation Overview](/Simulations/Simulation-overview) - Understand the full simulation framework
* [Analytics](/Simulations/Analytics) - View simulation analytics over time
* [Simulations](/Simulations/text-simulations/Simulations) - Create scenarios that generate test runs
* [Evaluators](/Evaluators/text-evaluators) - Configure scoring logic for simulations
* [Traces](/Observability/Traces/overview) - Debug simulation turns with execution traces
**Scenario Section**:
| Field | Value |
| ---------------- | ------------------------------------------------------------------- |
| **Goal** | The scenario objective (e.g., "Get a refund for a damaged product") |
| **Max Turns** | Maximum turns allowed (e.g., 5) |
| **User Persona** | The persona used (e.g., Frustrated) |
**User Data Section**:
Shows all context data provided to the simulated user:
```json theme={null}
{
"order id": "3",
"product name": "laptop stand"
}
```
**Fact Checker Section**:
Shows facts the agent needed to communicate:
```json theme={null}
{
"item usage": "unused",
"refund window": "7 days",
"days since delivery": "28"
}
```
**Provider Configuration Section**:
| Field | Value |
| ------------ | --------------------------------------------- |
| **Provider** | The LLM provider used (e.g., openai) |
| **Model** | The model used for simulation (e.g., gpt-4.1) |
For voice simulations, the provider section additionally shows the STT, reasoning LLM, and TTS stages configured for the call.
The Scenario Details tab is crucial for understanding the context of each
simulation. It shows exactly what data the simulated user had access to and
what facts the agent was expected to communicate.
## Analyzing Simulation Results
### Identifying Patterns
When reviewing simulation test runs, look for:
* **Goal achievement rates**: What percentage of simulations achieved their goals?
* **Persona differences**: Does your agent perform better with certain personas? Run the same scenarios with all persona types and compare results.
* **Turn efficiency**: Are conversations longer than necessary? Compare turn counts for successful vs failed scenarios.
* **Common failure points**: Which turns typically cause issues?
* **Fact accuracy**: Are specific facts consistently missed?
* **Cost trends**: Monitor total cost across test runs and identify scenarios that consume excessive turns.
### Voice-Specific Analysis
When reviewing voice simulation test runs, also look for:
* **Transcription failures**: High Word Error Rate on noisy scenarios suggests your STT stage needs tuning
* **Unnatural delivery**: Low Humanness or Expressiveness scores point at TTS voice choice or prompt phrasing
* **Slow first responses**: Time to First Transcript failures make calls feel laggy — check your streaming configuration
* **Talking over callers**: Backchannelling Naturalness failures reveal agents that cut users off
* **Unbalanced dialogue**: Speaking Percentage outside the healthy range means your agent dominates or under-participates
### Debugging Failed Simulations
For each failed scenario:
1. **Review the Conversation tab**: Identify where the conversation went wrong
2. **Check the Evaluation Results tab**: See which evaluators failed and why
3. **Examine the Scenario Details tab**: Verify the user data and facts were correct
4. **Click View Trace**: Inspect the full execution flow for problematic turns — check LLM inputs, tool calls, and latency breakdowns
### Comparing Across Runs
To track improvement or regression:
1. Run simulations after each agent update
2. Use the built-in [Compare view](#comparing-runs) for side-by-side deltas across runs
3. Investigate scenarios that changed from pass to fail
4. Track turn efficiency and cost trends over time
## Best Practices
* **Test after every agent change**: Run simulations when updating your agent to catch regressions early
* **Create baseline runs**: Establish performance benchmarks before making changes
* **Always check traces for failures**: Don't just read the conversation — inspect the execution flow, LLM context, and tool calls
* **Review latency**: Identify slow turns that might frustrate real users
* **Listen before you read** (voice): Audio context often explains scores that look wrong on paper
* **Run noisy variants** (voice): Once calls pass in quiet conditions, re-run with background noise enabled
* **Compare across pipeline changes** (voice): Use run comparison whenever you switch STT/TTS providers
* **Watch latency early** (voice): TTFT problems compound — fix them before tuning content quality
## Related
* [Simulation Overview](/Simulations/Simulation-overview) - Understand the full simulation framework
* [Analytics](/Simulations/Analytics) - View simulation analytics over time
* [Simulations](/Simulations/text-simulations/Simulations) - Create scenarios that generate test runs
* [Evaluators](/Evaluators/text-evaluators) - Configure scoring logic for simulations
* [Traces](/Observability/Traces/overview) - Debug simulation turns with execution traces