> ## Documentation Index
> Fetch the complete documentation index at: https://docs.getnetra.ai/llms.txt
> Use this file to discover all available pages before exploring further.
# Test Runs
> View and analyze Netra evaluation test run results. Track scores per evaluator, compare runs over time, and identify quality regressions in your AI.
Test Runs are the execution results of your [evaluations](/Evaluations/text-evaluations/Datasets) through the evaluation pipeline. Each run provides a point-in-time snapshot of your AI system's performance—showing exactly which test cases passed, which failed, and why. Use them to track quality over time, catch regressions, and debug issues.
## Why Test Runs Matter
Test Runs transform raw evaluation data into actionable insights:
| Capability | Benefit |
| ----------------------- | ------------------------------------------------------------------------------------- |
| **Historical Tracking** | Compare results across releases to detect regressions |
| **Deep Diagnostics** | See expected vs. actual output for every test case |
| **Trace Integration** | Jump directly to execution [traces](/Observability/Traces/overview) to debug failures |
| **Aggregated Metrics** | Monitor cost, latency, and pass rates at a glance |
| **Visual Comparison** | For image evaluations, see input images alongside generated outputs |
## Triggering a Test Run
There are two ways to trigger a test run.
### From the SDK
You provide an [evaluation](/Evaluations/text-evaluations/Datasets), a task function that processes each input, and a name for the run.
```python Python theme={null}
from netra import Netra
Netra.init(app_name="my-app")
def my_task(input_data):
# Your AI logic — takes the input from each evaluation item
# and returns the generated output as a string
return response
dataset = Netra.evaluation.get_dataset(dataset_id="your-dataset-id")
result = Netra.evaluation.run_test_suite(
name="My Evaluation",
data=dataset,
task=my_task,
)
```
```typescript TypeScript theme={null}
import { Netra } from "netra-sdk";
await Netra.init({ appName: "my-app" });
async function myTask(inputData: string): Promise {
// Your AI logic — takes the input from each evaluation item
// and returns the generated output as a string
return response;
}
const dataset = await Netra.evaluation.getDataset("your-dataset-id");
const result = await Netra.evaluation.runTestSuite(
"My Evaluation",
dataset,
myTask,
);
```
The task function receives the `input` field from each evaluation item. The output is compared against `expectedOutput` by the evaluators attached to the evaluation. See the SDK reference for [Python](/sdk-reference/evaluation/python) and [TypeScript](/sdk-reference/evaluation/typescript) for the full API.
### From the Dashboard
Connect your AI application under **Evaluation → Agents** so Netra can call it. See [Agents](/Evaluations/text-evaluations/agents).
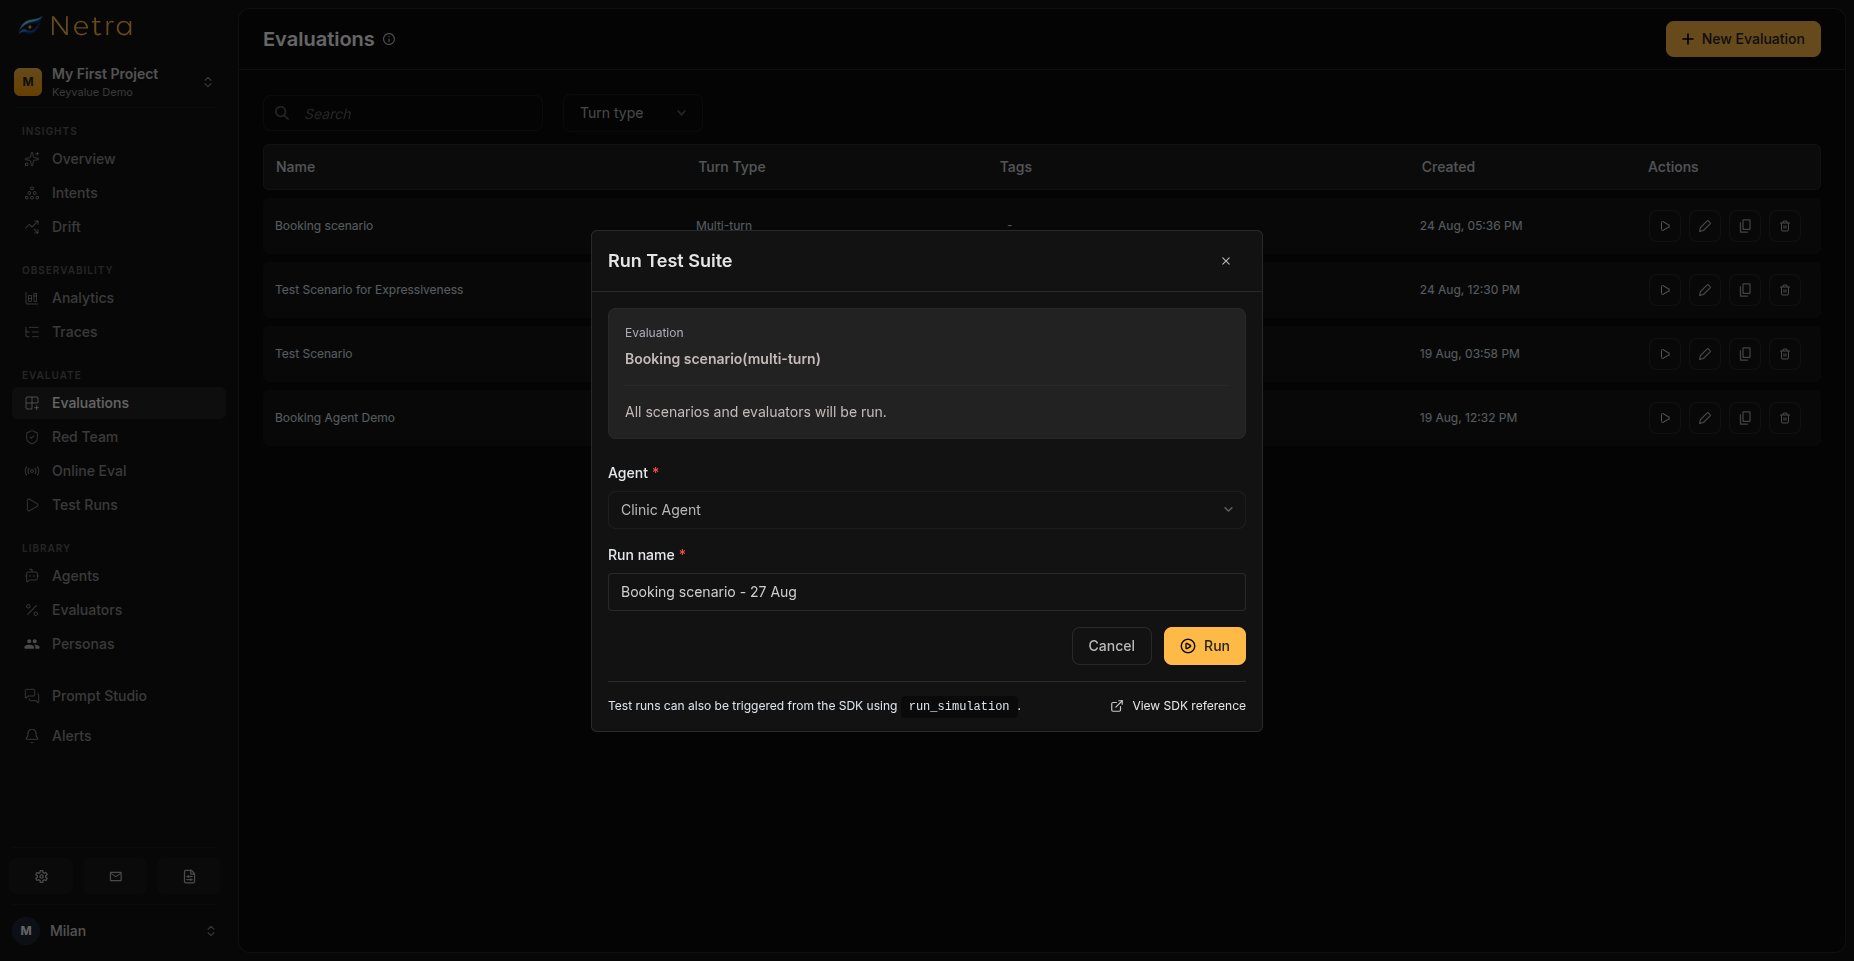
Open your evaluation, go to the **Test Runs** tab, and click **Run Test Suite**.
Pick the registered agent, give the run a name, and start. Netra calls your agent for every test case and evaluates each response.
 ## Test Runs Dashboard
Navigate to **Evaluate → Test Runs** from the left navigation panel.
## Test Runs Dashboard
Navigate to **Evaluate → Test Runs** from the left navigation panel.
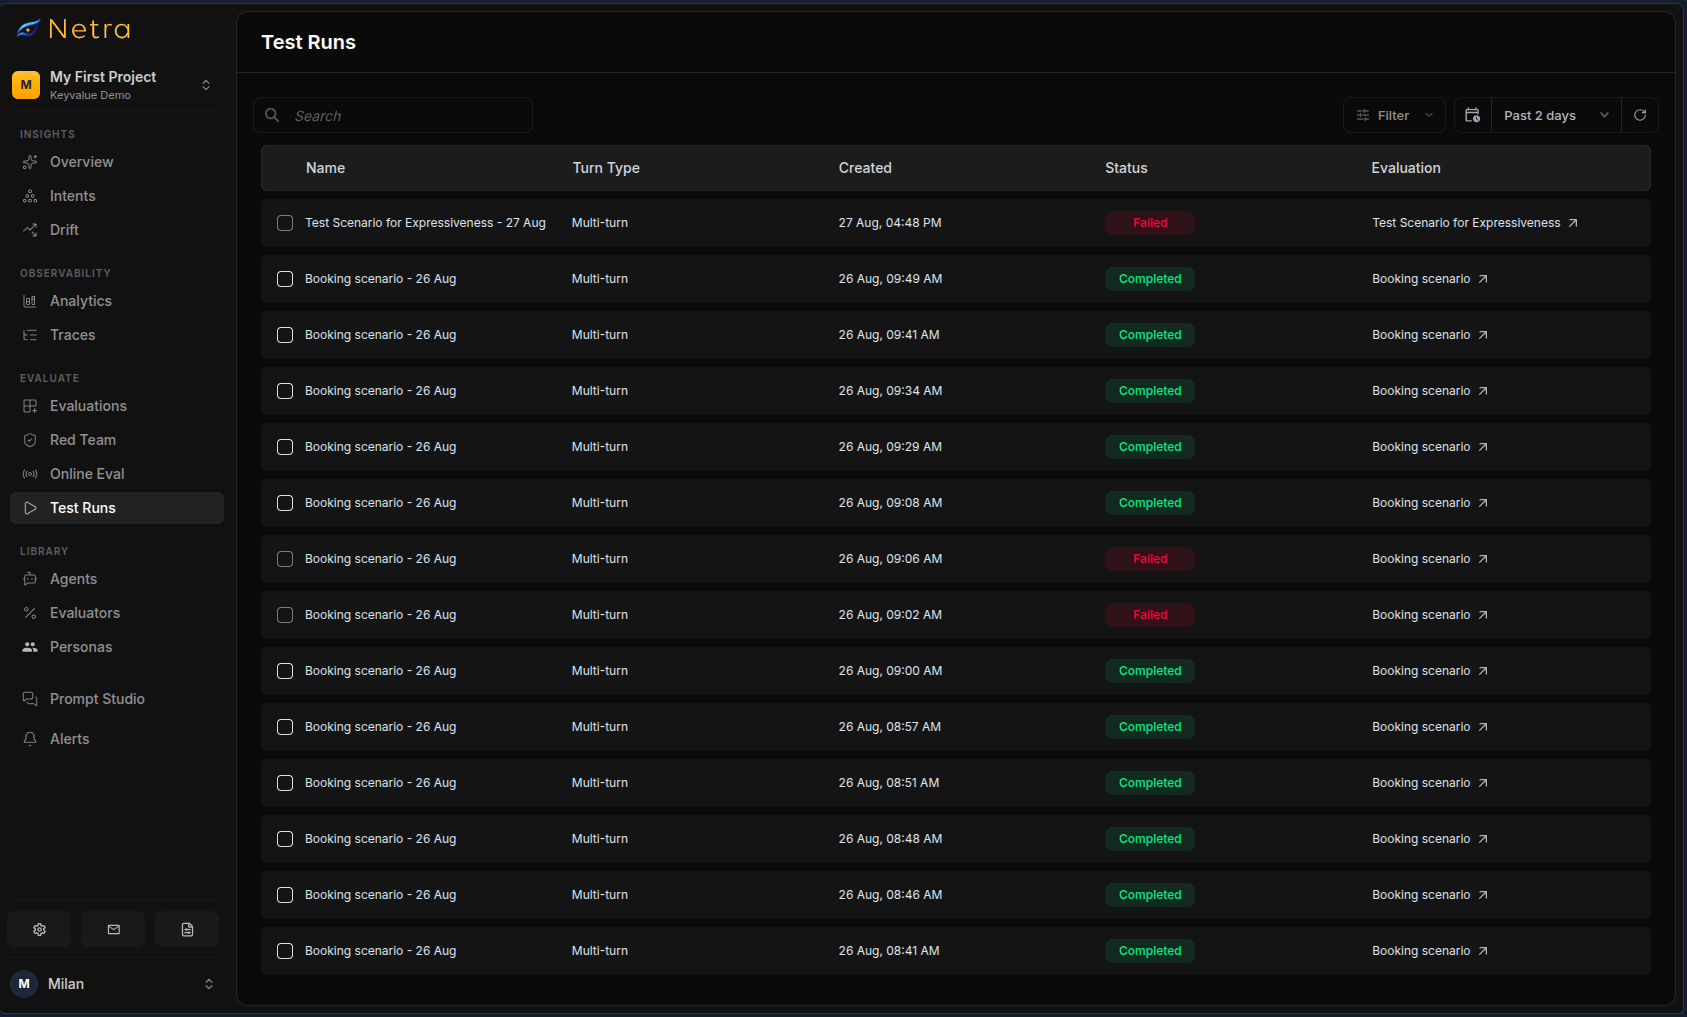 | Column | Description |
| -------------- | -------------------------------------------- |
| **Name** | Name of the test run |
| **Turn Type** | Single-turn or multi-turn |
| **Created** | Timestamp when the evaluation began |
| **Status** | Current state: Completed, Running, or Failed |
| **Evaluation** | Pass/fail summary across evaluators |
### Filtering and Search
* **Date Range**: Filter runs by time period to compare performance over time
* **Search**: Find specific test runs by name or evaluation
* **Filters**: Narrow by run status or evaluation
## Viewing Test Run Details
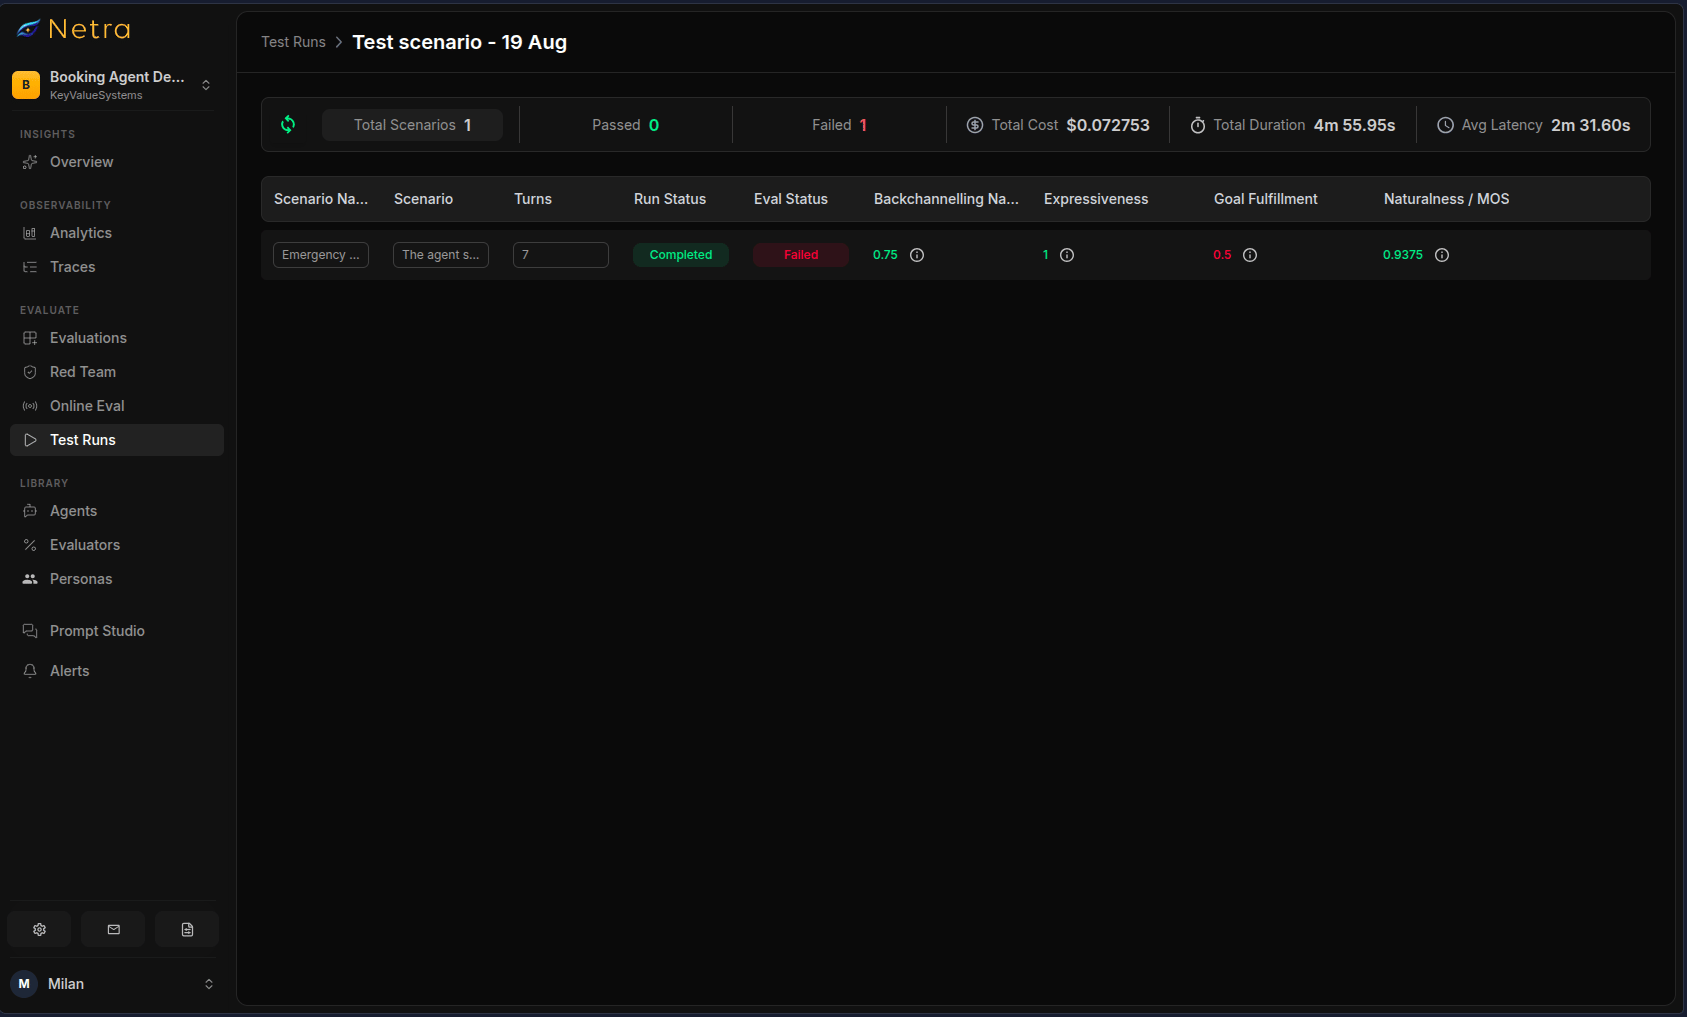
Click on any test run to access detailed results and diagnostics.
| Column | Description |
| -------------- | -------------------------------------------- |
| **Name** | Name of the test run |
| **Turn Type** | Single-turn or multi-turn |
| **Created** | Timestamp when the evaluation began |
| **Status** | Current state: Completed, Running, or Failed |
| **Evaluation** | Pass/fail summary across evaluators |
### Filtering and Search
* **Date Range**: Filter runs by time period to compare performance over time
* **Search**: Find specific test runs by name or evaluation
* **Filters**: Narrow by run status or evaluation
## Viewing Test Run Details
Click on any test run to access detailed results and diagnostics.
 ### Summary Metrics
The top of the detail view shows aggregated performance data:
| Metric | Description |
| ------------------- | ------------------------------------------------- |
| **Total Cost** | Aggregate token/API cost for all test cases |
| **Total Duration** | End-to-end time for the evaluation run |
| **Average Latency** | Mean response time across test cases |
| **Pass/Fail Rate** | Percentage and count of passing vs. failing cases |
### Per-Test-Case Results
The items table lists every test case with dynamically generated columns—one per configured evaluator—alongside:
| Field | Description |
| -------------------- | ---------------------------------------------------------------------------------------------- |
| **Input** | The prompt or query sent to your AI system |
| **Expected Output** | The reference answer defined in your [evaluation](/Evaluations/text-evaluations/Datasets) |
| **Task Output** | The actual response generated by your AI (or image URL for image evaluations) |
| **Run Status** | Shows running status (Running or Completed) |
| **Eval Status** | Pass, Fail, or Not Available based on [evaluator](/Evaluators/text-evaluators) criteria |
| **Evaluator Scores** | One column per evaluator with its score and verdict |
| **View Trace** | Opens the full execution [trace](/Observability/Traces/overview) in a slide-over for debugging |
Click any row to open the item detail panel with two tabs:
| Tab | Description |
| --------------- | --------------------------------------------------------------------------------------------------------------- |
| **Evaluations** | Per-evaluator score, pass/fail verdict, textual reasoning, and the resolved variable values used during scoring |
| **Details** | Input, expected output, and task output side-by-side (with image preview for image evaluations) |
Click **View Trace** on any failed test case to see the complete execution
timeline, including LLM calls, tool invocations, and latency breakdowns.
## Comparing Test Runs
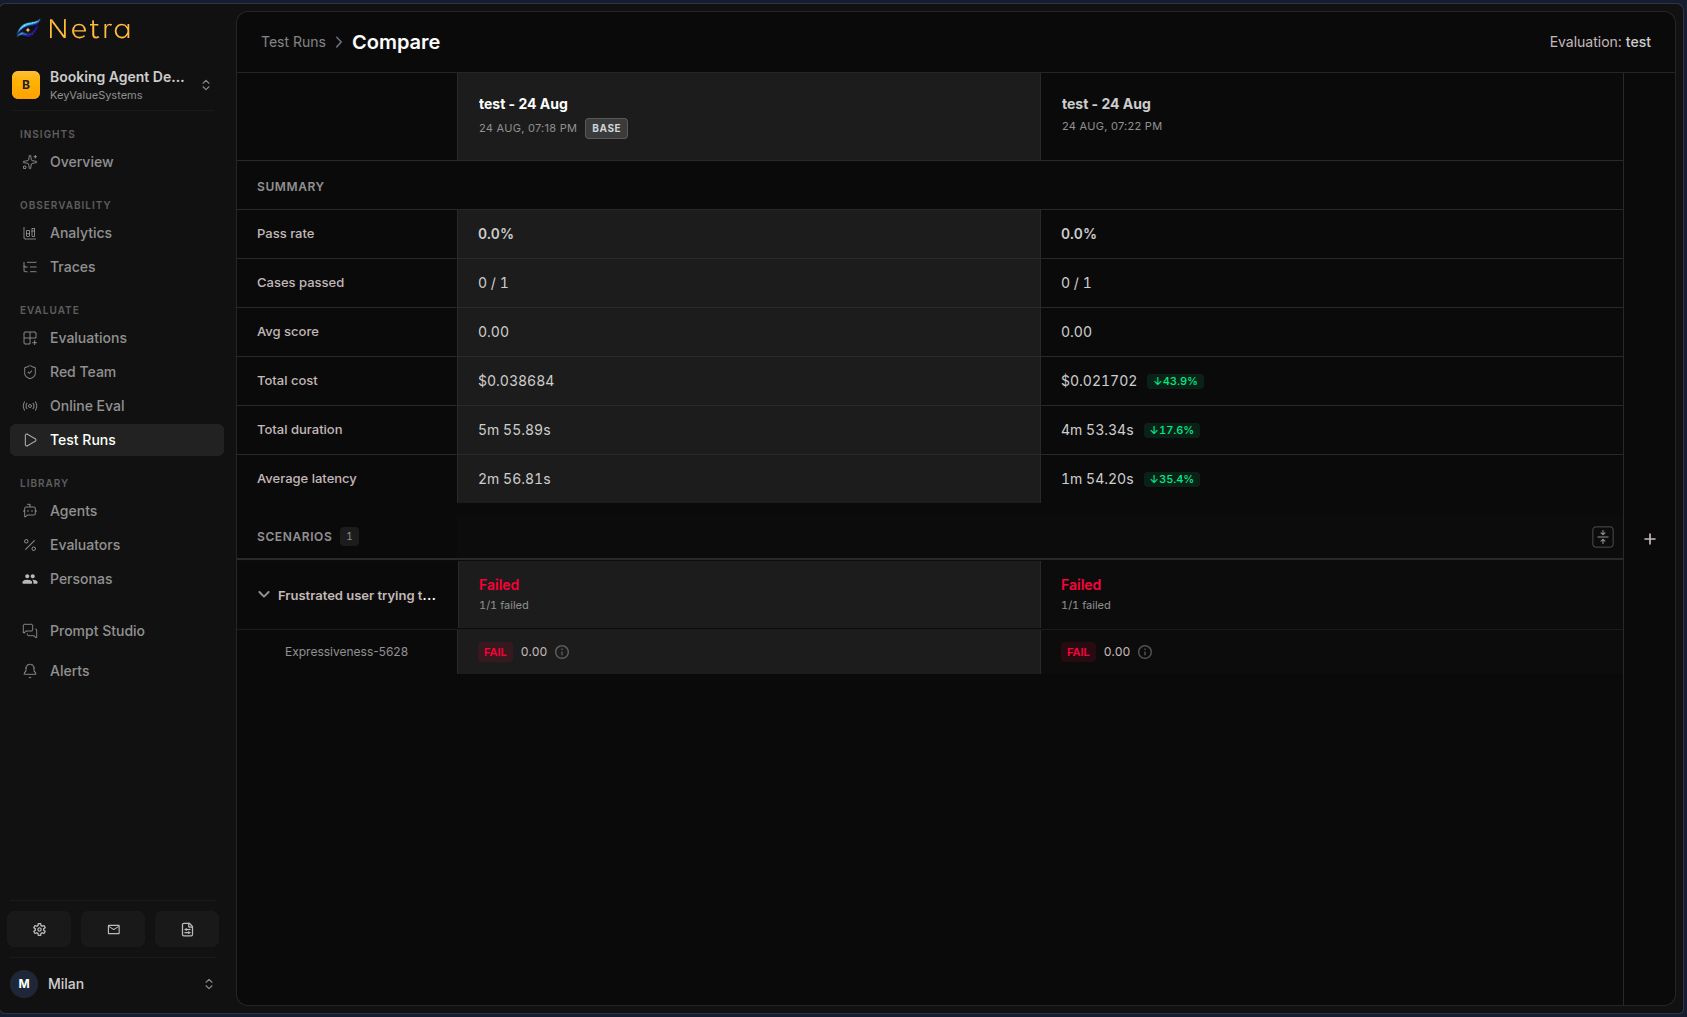
Compare multiple runs of the same evaluation to spot regressions and improvements:
On the Test Runs dashboard, select at least two completed runs of the same evaluation using the checkboxes.
Click **Compare**. The comparison view aligns test cases across runs.
* Summary metrics show pass rate, average score, total cost, duration, and average latency with percent deltas against a base run
* Each evaluator gets a verdict cell per test case so you can see exactly which cases flipped from pass to fail
### Summary Metrics
The top of the detail view shows aggregated performance data:
| Metric | Description |
| ------------------- | ------------------------------------------------- |
| **Total Cost** | Aggregate token/API cost for all test cases |
| **Total Duration** | End-to-end time for the evaluation run |
| **Average Latency** | Mean response time across test cases |
| **Pass/Fail Rate** | Percentage and count of passing vs. failing cases |
### Per-Test-Case Results
The items table lists every test case with dynamically generated columns—one per configured evaluator—alongside:
| Field | Description |
| -------------------- | ---------------------------------------------------------------------------------------------- |
| **Input** | The prompt or query sent to your AI system |
| **Expected Output** | The reference answer defined in your [evaluation](/Evaluations/text-evaluations/Datasets) |
| **Task Output** | The actual response generated by your AI (or image URL for image evaluations) |
| **Run Status** | Shows running status (Running or Completed) |
| **Eval Status** | Pass, Fail, or Not Available based on [evaluator](/Evaluators/text-evaluators) criteria |
| **Evaluator Scores** | One column per evaluator with its score and verdict |
| **View Trace** | Opens the full execution [trace](/Observability/Traces/overview) in a slide-over for debugging |
Click any row to open the item detail panel with two tabs:
| Tab | Description |
| --------------- | --------------------------------------------------------------------------------------------------------------- |
| **Evaluations** | Per-evaluator score, pass/fail verdict, textual reasoning, and the resolved variable values used during scoring |
| **Details** | Input, expected output, and task output side-by-side (with image preview for image evaluations) |
Click **View Trace** on any failed test case to see the complete execution
timeline, including LLM calls, tool invocations, and latency breakdowns.
## Comparing Test Runs
Compare multiple runs of the same evaluation to spot regressions and improvements:
On the Test Runs dashboard, select at least two completed runs of the same evaluation using the checkboxes.
Click **Compare**. The comparison view aligns test cases across runs.
* Summary metrics show pass rate, average score, total cost, duration, and average latency with percent deltas against a base run
* Each evaluator gets a verdict cell per test case so you can see exactly which cases flipped from pass to fail
 ## Managing the Underlying Evaluation
Evaluation configuration lives on the evaluation page, not inside individual runs:
* **Add or edit test cases** — open the evaluation's **Details** tab. See [Evaluations](/Evaluations/text-evaluations/Datasets).
* **Add evaluators or adjust thresholds** — use the evaluation's default evaluator settings; overrides can be set per item
* **Trigger a new run** — use the **Test Runs** tab on the evaluation page
## Analyzing Results
### Identifying Patterns
When reviewing test runs, look for:
* **Consistent failures**: Same test cases failing across multiple runs may indicate a systematic issue
* **New failures**: Test cases that previously passed but now fail signal a regression
* **Score trends**: Declining evaluator scores over time suggest gradual quality degradation
### Debugging Failures
For each failed test case:
1. Compare **Expected Output** vs **Task Output** to understand the discrepancy
2. Check **Evaluator Scores** to see which criteria failed
3. Click **View Trace** to inspect the full execution flow
4. Review LLM inputs, tool calls, and intermediate steps in the [trace view](/Observability/Traces/overview)
### Comparing Across Runs
To track regression or improvement:
1. Run evaluations after each significant change (model update, prompt revision, code release)
2. Use the built-in [Compare view](#comparing-test-runs) for side-by-side deltas
3. Investigate any test cases that changed from pass to fail
## Use Cases
### CI/CD Integration
Run evaluations as part of your deployment pipeline:
1. Trigger evaluation when code is pushed
2. Block deployment if pass rate drops below threshold
3. Review failed cases before merging
### Model Comparison
Evaluate different models objectively:
1. Run the same [evaluation](/Evaluations/text-evaluations/Datasets) with different model configurations
2. Compare test runs side-by-side
3. Make data-driven decisions about which model to deploy
### Prompt Iteration
Measure the impact of prompt changes:
1. Create a baseline test run with your current prompt
2. Update your prompt and run again
3. Compare results to validate improvement
### Image Quality Testing
Evaluate AI-generated or edited images for visual quality and accuracy:
1. Create an [image evaluation](/Evaluations/image-evaluations/Datasets) with input prompts and expected image characteristics
2. Run evaluations after each model or prompt change
3. Compare visual quality scores across test runs
## Related
* [Evaluation Overview](/Evaluations/Evaluation-overview) - Understand the full evaluation framework
* [Analytics](/Evaluations/Analytics) - View evaluation analytics over time
* [Evaluations](/Evaluations/text-evaluations/Datasets) - Create and manage test case collections
* [Evaluators](/Evaluators/text-evaluators) - Configure scoring logic and criteria
* [Traces](/Observability/Traces/overview) - Debug failed test cases with execution traces
* [Quick Start: Evaluation](/quick-start/QuickStart_Evals) - Get started with evaluations
## Managing the Underlying Evaluation
Evaluation configuration lives on the evaluation page, not inside individual runs:
* **Add or edit test cases** — open the evaluation's **Details** tab. See [Evaluations](/Evaluations/text-evaluations/Datasets).
* **Add evaluators or adjust thresholds** — use the evaluation's default evaluator settings; overrides can be set per item
* **Trigger a new run** — use the **Test Runs** tab on the evaluation page
## Analyzing Results
### Identifying Patterns
When reviewing test runs, look for:
* **Consistent failures**: Same test cases failing across multiple runs may indicate a systematic issue
* **New failures**: Test cases that previously passed but now fail signal a regression
* **Score trends**: Declining evaluator scores over time suggest gradual quality degradation
### Debugging Failures
For each failed test case:
1. Compare **Expected Output** vs **Task Output** to understand the discrepancy
2. Check **Evaluator Scores** to see which criteria failed
3. Click **View Trace** to inspect the full execution flow
4. Review LLM inputs, tool calls, and intermediate steps in the [trace view](/Observability/Traces/overview)
### Comparing Across Runs
To track regression or improvement:
1. Run evaluations after each significant change (model update, prompt revision, code release)
2. Use the built-in [Compare view](#comparing-test-runs) for side-by-side deltas
3. Investigate any test cases that changed from pass to fail
## Use Cases
### CI/CD Integration
Run evaluations as part of your deployment pipeline:
1. Trigger evaluation when code is pushed
2. Block deployment if pass rate drops below threshold
3. Review failed cases before merging
### Model Comparison
Evaluate different models objectively:
1. Run the same [evaluation](/Evaluations/text-evaluations/Datasets) with different model configurations
2. Compare test runs side-by-side
3. Make data-driven decisions about which model to deploy
### Prompt Iteration
Measure the impact of prompt changes:
1. Create a baseline test run with your current prompt
2. Update your prompt and run again
3. Compare results to validate improvement
### Image Quality Testing
Evaluate AI-generated or edited images for visual quality and accuracy:
1. Create an [image evaluation](/Evaluations/image-evaluations/Datasets) with input prompts and expected image characteristics
2. Run evaluations after each model or prompt change
3. Compare visual quality scores across test runs
## Related
* [Evaluation Overview](/Evaluations/Evaluation-overview) - Understand the full evaluation framework
* [Analytics](/Evaluations/Analytics) - View evaluation analytics over time
* [Evaluations](/Evaluations/text-evaluations/Datasets) - Create and manage test case collections
* [Evaluators](/Evaluators/text-evaluators) - Configure scoring logic and criteria
* [Traces](/Observability/Traces/overview) - Debug failed test cases with execution traces
* [Quick Start: Evaluation](/quick-start/QuickStart_Evals) - Get started with evaluations