> ## Documentation Index
> Fetch the complete documentation index at: https://docs.getnetra.ai/llms.txt
> Use this file to discover all available pages before exploring further.
# Custom Dashboard
> Build custom analytics dashboards in Netra to monitor AI cost, latency, and quality. Create charts, apply filters, set time ranges, and share with your team.
Custom Dashboards enable you to create tailored analytics views that surface the metrics most important to your team. Whether you're tracking costs across tenants, monitoring latency for specific models, or analyzing error rates by environment, custom dashboards give you the flexibility to visualize your data exactly how you need it.
Monitor your AI application's performance with live-updating widgets and configurable refresh intervals.
Choose from 6 chart types to display your data in the most meaningful way for your use case.
Segment data by environment, user, session, or tenant to uncover patterns and anomalies.
Create widgets once and add them to multiple dashboards for consistent reporting across teams.
***
## Accessing Custom Dashboards
Click the profile icon in the top-right corner and select **Organization Analytics**
In the left navigation panel, click on **Custom**
Select either **Custom Dashboards** to view dashboards or **Widgets** to manage individual widgets
***
## Dashboard Management
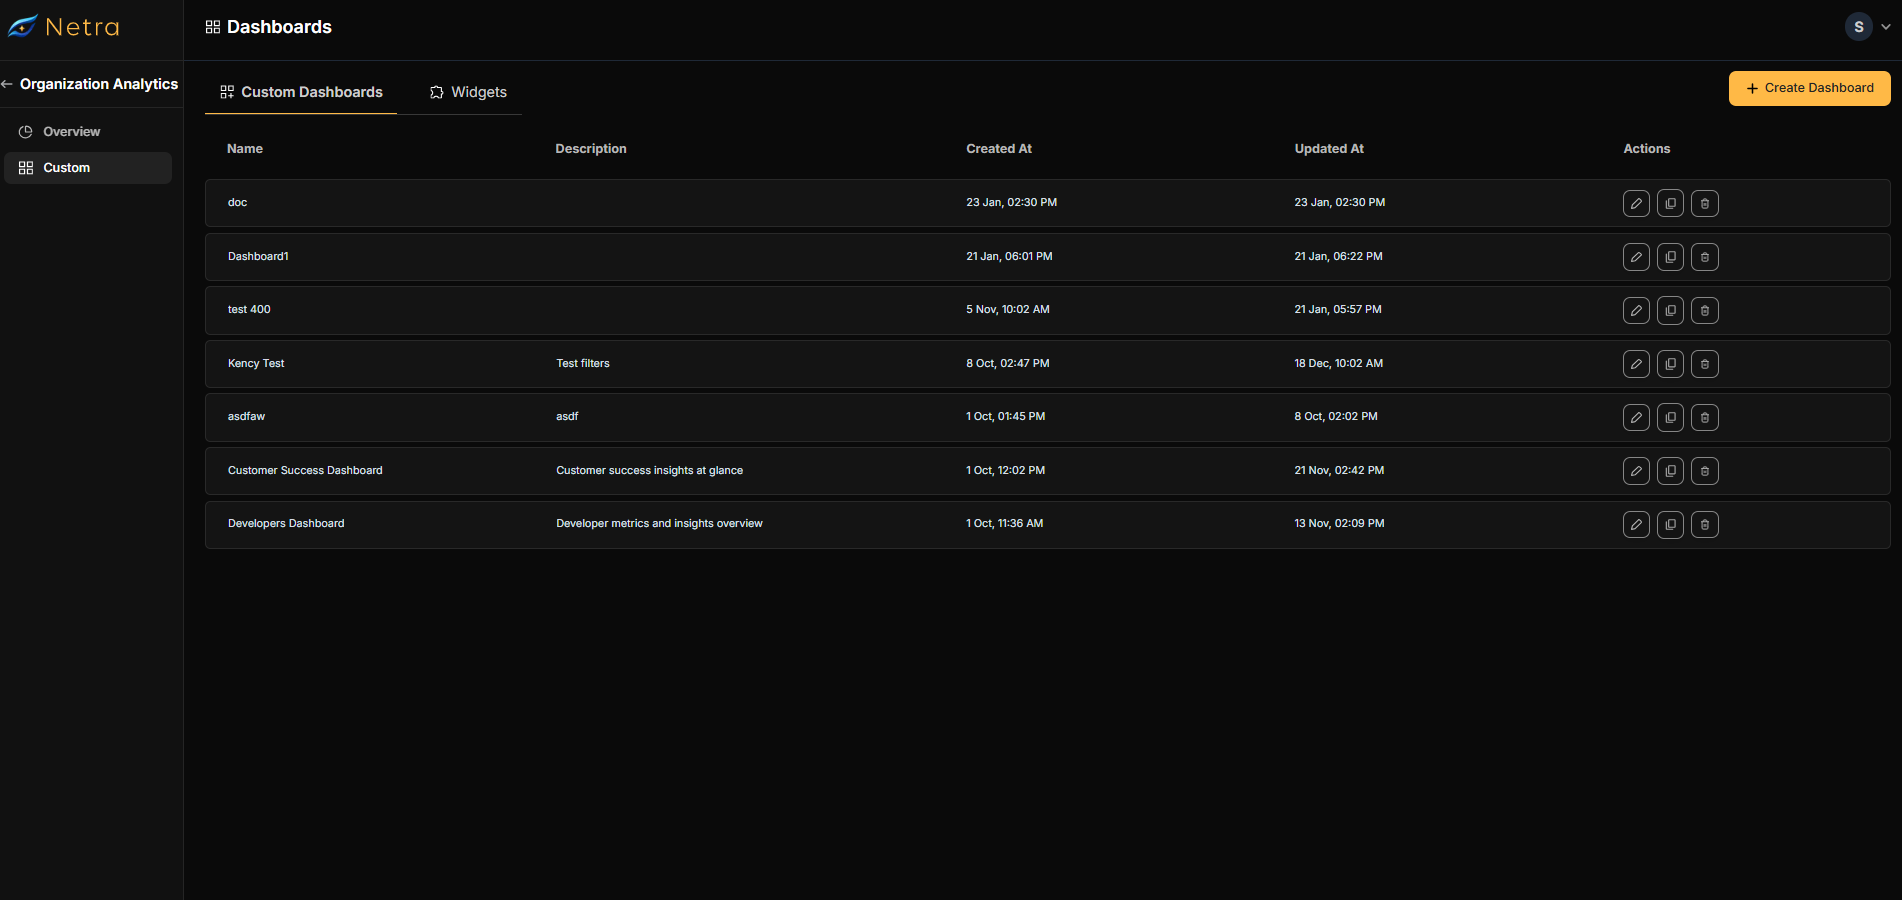
The Custom Dashboards tab displays all your dashboards with key information:
| Column | Description |
| ----------------- | ---------------------- |
| **Name** | Dashboard identifier |
| **Description** | Purpose and contents |
| **Created** | Creation timestamp |
| **Last Modified** | Most recent update |
| **Actions** | Edit, clone, or delete |
 ### Creating a New Dashboard
Click **Create Dashboard** in the top-right corner of the Custom Dashboards tab
Enter a descriptive **name** and **description** for your dashboard
Click **Create Dashboard** to confirm, or **Cancel** to abort
Click **Add Widget** to open the widget selector
Check the boxes next to the widgets you want to include
Click **Add Selected Widget** to add them to your dashboard
Use the **Create New Widget** button in the widget selector to quickly create a new widget without leaving the dashboard editor.
### Dashboard Actions
| Action | Description |
| ---------- | --------------------------------------------------- |
| **Edit** | Modify dashboard name, description, and widgets |
| **Clone** | Create a copy of the dashboard with all its widgets |
| **Delete** | Permanently remove the dashboard |
***
## Widget Management
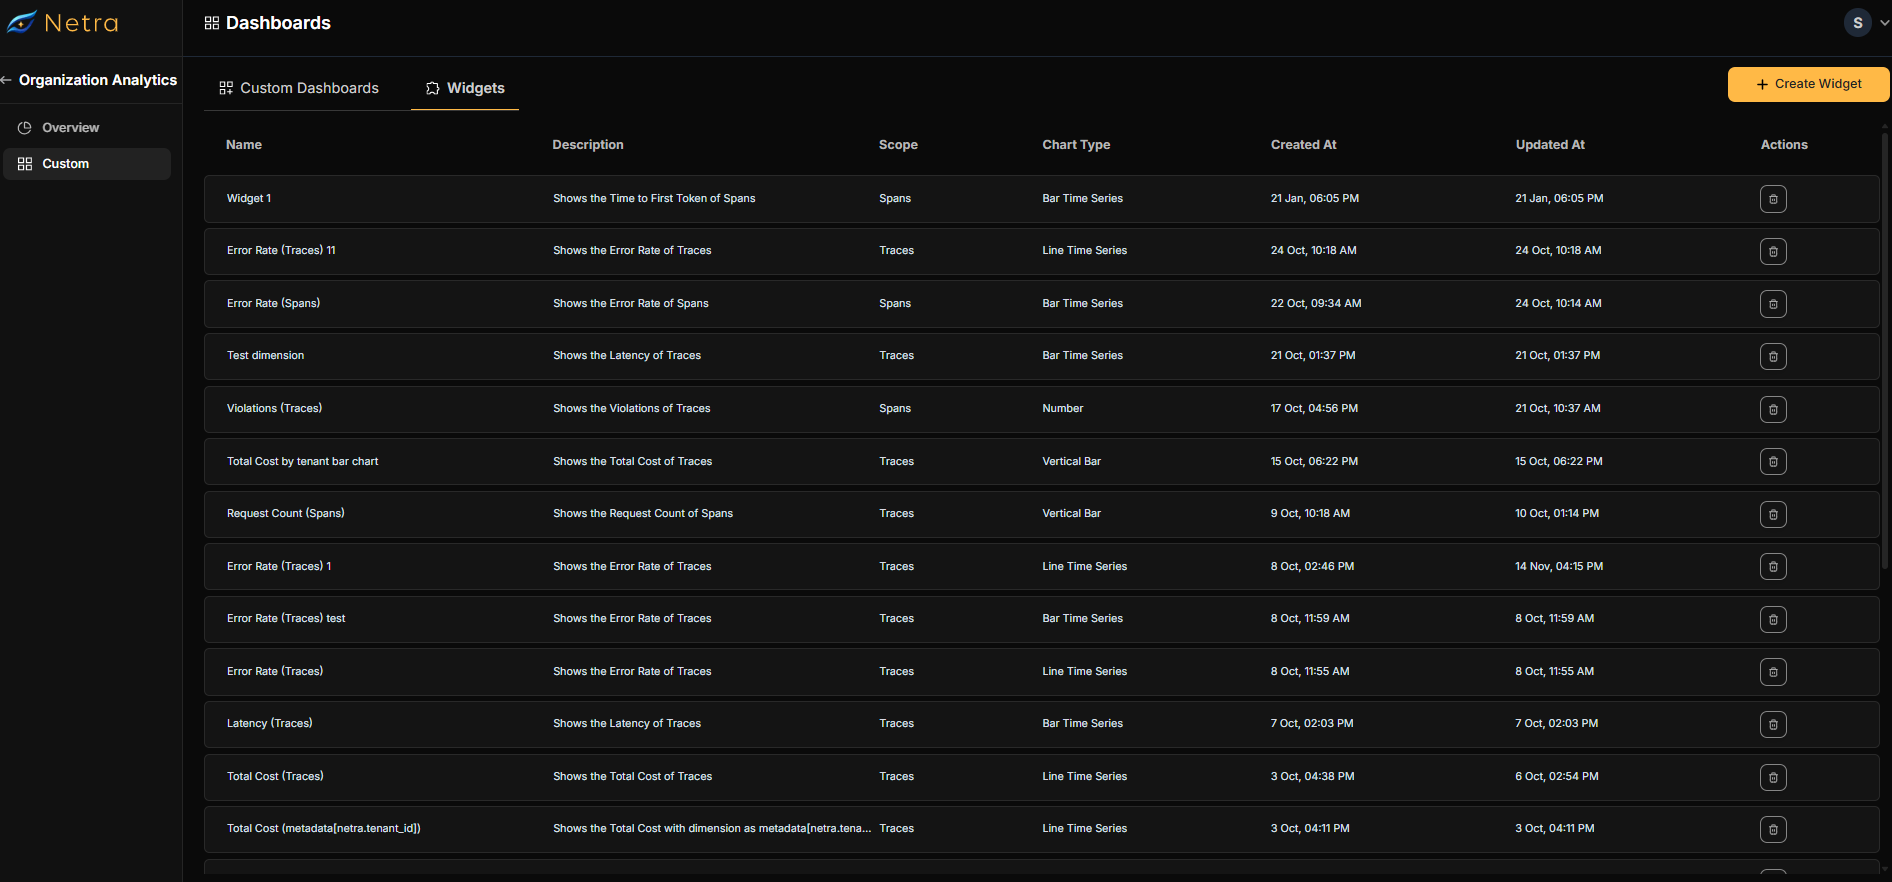
Widgets are the building blocks of your dashboards. Create them once and reuse them across multiple dashboards.
### Creating a New Dashboard
Click **Create Dashboard** in the top-right corner of the Custom Dashboards tab
Enter a descriptive **name** and **description** for your dashboard
Click **Create Dashboard** to confirm, or **Cancel** to abort
Click **Add Widget** to open the widget selector
Check the boxes next to the widgets you want to include
Click **Add Selected Widget** to add them to your dashboard
Use the **Create New Widget** button in the widget selector to quickly create a new widget without leaving the dashboard editor.
### Dashboard Actions
| Action | Description |
| ---------- | --------------------------------------------------- |
| **Edit** | Modify dashboard name, description, and widgets |
| **Clone** | Create a copy of the dashboard with all its widgets |
| **Delete** | Permanently remove the dashboard |
***
## Widget Management
Widgets are the building blocks of your dashboards. Create them once and reuse them across multiple dashboards.
 ### Creating a New Widget
Click **Create Widget** to open the configuration page with two sections:
* **Left panel** - Configuration options
* **Right panel** - Live preview
| Field | Description |
| --------------- | --------------------------------------------- |
| **Name** | Unique identifier (no duplicates allowed) |
| **Description** | Brief explanation of what the widget displays |
**Widget Scope** - Choose your data source:
| Scope | Description |
| ---------- | --------------------------- |
| **Traces** | Aggregated trace-level data |
| **Spans** | Individual span-level data |
**Metric** - Select what to measure (options vary by scope)
| Metric | Aggregation Methods |
| ----------------------- | ----------------------------------- |
| **Error Rate** | Percentage, Total Count |
| **Latency** | Average, P50, P90, P95, P99, Median |
| **Request Count** | Total Count |
| **Total Cost** | Sum |
| **Total Tokens** | Sum |
| **Time to First Token** | Average, P50, P90, P95, P99 |
| **Custom** | Select a custom metric |
| Chart Type | Best For |
| -------------------- | ---------------------------- |
| **Line Time Series** | Trends over time |
| **Bar Time Series** | Periodic comparisons |
| **Horizontal Bar** | Ranking/comparing categories |
| **Vertical Bar** | Category comparisons |
| **Pie Chart** | Proportional distribution |
| **Big Number** | Single KPI display |
Segment your data by:
| Dimension | Use Case |
| --------------- | ------------------------------ |
| **Environment** | Compare prod vs staging vs dev |
| **User ID** | Per-user analysis |
| **Session ID** | Session-level breakdown |
| **Tenant ID** | Multi-tenant comparisons |
Narrow down your data with filters:
| Filter | Options |
| ------------- | ------------ |
| **Violation** | True / False |
| **PII** | True / False |
| **Error** | True / False |
| Filter | Operators |
| ---------- | ---------------- |
| **Models** | Any of / None of |
| Filter | Operators |
| -------------- | ----------------------------------------------------------------------- |
| **Session ID** | Equals / Not equals / Contains |
| **User ID** | Equals / Not equals / Contains |
| **Metadata** | Equals / Not equals / Contains / Not contains / Starts with / Ends with |
| Filter | Operators |
| -------------- | ----------------------------------------------------------- |
| **Latency** | Greater than / Less than / Greater or equal / Less or equal |
| **Total Cost** | Greater than / Less than / Greater or equal / Less or equal |
Review the live preview on the right, then click **Add Widget** to save
The **Widget Preview** section shows a real-time visualization with a date range filter, allowing you to verify your configuration before saving.
***
## Best Practices
Use clear names like "Daily Cost by Model" instead of "Cost Widget 1" for easier discovery.
Begin with 3-5 essential widgets, then expand based on team feedback.
Keep related widgets on the same time range for accurate comparisons.
Create separate dashboards for different concerns (cost, performance, quality).
***
## Common Use Cases
Track spending across your AI infrastructure:
* **Total Cost by Model** - Pie chart showing cost distribution across different models
* **Daily Cost Trend** - Line time series tracking cost over time
* **Cost by Tenant** - Horizontal bar comparing costs across customers
* **High-Cost Sessions** - Filter for sessions exceeding cost thresholds
**Recommended filters:** Total Cost > threshold, grouped by Model or Tenant ID
Monitor latency and throughput metrics:
* **P95 Latency Trend** - Line chart tracking latency percentiles over time
* **Request Count by Environment** - Bar chart comparing prod vs staging traffic
* **Time to First Token** - Track streaming response performance
* **Latency by Model** - Compare response times across different models
**Recommended filters:** Environment = production, grouped by Model Name
Track errors, violations, and PII detection:
* **Error Rate Trend** - Line chart showing error percentage over time
* **Violation Count** - Big number widget for policy violations
* **PII Detection by Service** - Bar chart showing PII occurrences
* **Error Rate by Environment** - Compare error rates across deployments
**Recommended filters:** Error = true, Violation = true, grouped by Environment
Multi-tenant usage analysis:
* **Usage by Tenant** - Horizontal bar showing request distribution
* **Cost per Tenant** - Track spending by customer
* **Token Usage Trend** - Monitor token consumption over time
* **Active Sessions by Tenant** - Compare engagement across customers
**Recommended filters:** Grouped by Tenant ID, sorted by Total Cost
***
## Next Steps
* [Dashboard Query API](/sdk-reference/dashboard-query/python) - Query dashboard data programmatically
* [Usage, Traces & Spans](/usage/usage-utilities) - Query usage data
* [Sessions](/Observability/Session) - Understand session management
* [Tenants](/Observability/Tenants) - Multi-tenant analytics
### Creating a New Widget
Click **Create Widget** to open the configuration page with two sections:
* **Left panel** - Configuration options
* **Right panel** - Live preview
| Field | Description |
| --------------- | --------------------------------------------- |
| **Name** | Unique identifier (no duplicates allowed) |
| **Description** | Brief explanation of what the widget displays |
**Widget Scope** - Choose your data source:
| Scope | Description |
| ---------- | --------------------------- |
| **Traces** | Aggregated trace-level data |
| **Spans** | Individual span-level data |
**Metric** - Select what to measure (options vary by scope)
| Metric | Aggregation Methods |
| ----------------------- | ----------------------------------- |
| **Error Rate** | Percentage, Total Count |
| **Latency** | Average, P50, P90, P95, P99, Median |
| **Request Count** | Total Count |
| **Total Cost** | Sum |
| **Total Tokens** | Sum |
| **Time to First Token** | Average, P50, P90, P95, P99 |
| **Custom** | Select a custom metric |
| Chart Type | Best For |
| -------------------- | ---------------------------- |
| **Line Time Series** | Trends over time |
| **Bar Time Series** | Periodic comparisons |
| **Horizontal Bar** | Ranking/comparing categories |
| **Vertical Bar** | Category comparisons |
| **Pie Chart** | Proportional distribution |
| **Big Number** | Single KPI display |
Segment your data by:
| Dimension | Use Case |
| --------------- | ------------------------------ |
| **Environment** | Compare prod vs staging vs dev |
| **User ID** | Per-user analysis |
| **Session ID** | Session-level breakdown |
| **Tenant ID** | Multi-tenant comparisons |
Narrow down your data with filters:
| Filter | Options |
| ------------- | ------------ |
| **Violation** | True / False |
| **PII** | True / False |
| **Error** | True / False |
| Filter | Operators |
| ---------- | ---------------- |
| **Models** | Any of / None of |
| Filter | Operators |
| -------------- | ----------------------------------------------------------------------- |
| **Session ID** | Equals / Not equals / Contains |
| **User ID** | Equals / Not equals / Contains |
| **Metadata** | Equals / Not equals / Contains / Not contains / Starts with / Ends with |
| Filter | Operators |
| -------------- | ----------------------------------------------------------- |
| **Latency** | Greater than / Less than / Greater or equal / Less or equal |
| **Total Cost** | Greater than / Less than / Greater or equal / Less or equal |
Review the live preview on the right, then click **Add Widget** to save
The **Widget Preview** section shows a real-time visualization with a date range filter, allowing you to verify your configuration before saving.
***
## Best Practices
Use clear names like "Daily Cost by Model" instead of "Cost Widget 1" for easier discovery.
Begin with 3-5 essential widgets, then expand based on team feedback.
Keep related widgets on the same time range for accurate comparisons.
Create separate dashboards for different concerns (cost, performance, quality).
***
## Common Use Cases
Track spending across your AI infrastructure:
* **Total Cost by Model** - Pie chart showing cost distribution across different models
* **Daily Cost Trend** - Line time series tracking cost over time
* **Cost by Tenant** - Horizontal bar comparing costs across customers
* **High-Cost Sessions** - Filter for sessions exceeding cost thresholds
**Recommended filters:** Total Cost > threshold, grouped by Model or Tenant ID
Monitor latency and throughput metrics:
* **P95 Latency Trend** - Line chart tracking latency percentiles over time
* **Request Count by Environment** - Bar chart comparing prod vs staging traffic
* **Time to First Token** - Track streaming response performance
* **Latency by Model** - Compare response times across different models
**Recommended filters:** Environment = production, grouped by Model Name
Track errors, violations, and PII detection:
* **Error Rate Trend** - Line chart showing error percentage over time
* **Violation Count** - Big number widget for policy violations
* **PII Detection by Service** - Bar chart showing PII occurrences
* **Error Rate by Environment** - Compare error rates across deployments
**Recommended filters:** Error = true, Violation = true, grouped by Environment
Multi-tenant usage analysis:
* **Usage by Tenant** - Horizontal bar showing request distribution
* **Cost per Tenant** - Track spending by customer
* **Token Usage Trend** - Monitor token consumption over time
* **Active Sessions by Tenant** - Compare engagement across customers
**Recommended filters:** Grouped by Tenant ID, sorted by Total Cost
***
## Next Steps
* [Dashboard Query API](/sdk-reference/dashboard-query/python) - Query dashboard data programmatically
* [Usage, Traces & Spans](/usage/usage-utilities) - Query usage data
* [Sessions](/Observability/Session) - Understand session management
* [Tenants](/Observability/Tenants) - Multi-tenant analytics