> ## Documentation Index
> Fetch the complete documentation index at: https://docs.getnetra.ai/llms.txt
> Use this file to discover all available pages before exploring further.
# Alert Rules
> Configure Netra alert rules to receive Slack or email notifications when your AI system exceeds cost, latency, error rate, or quality score thresholds.
Don't wait for users to report problems. Alert Rules proactively monitor your AI operations and notify you the moment something goes wrong—whether it's runaway costs, degraded performance, or elevated error rates. Catch issues before they impact users.
New to alerts? Set up your first alert rule in minutes.
## Why Alert Rules Matter
AI systems can fail silently. Costs creep up, latency degrades, and errors accumulate without obvious symptoms:
| Risk | How Alerts Help |
| --------------------------- | --------------------------------------------------------------------------- |
| **Cost Overruns** | Get notified when token spend exceeds thresholds per request or time period |
| **Performance Degradation** | Alert when latency spikes above acceptable levels |
| **Error Rate Spikes** | Detect when failures exceed normal baselines |
| **SLA Violations** | Monitor metrics that matter for your service commitments |
## Alert Rules Dashboard
Navigate to **Alert Rules** from the left navigation panel.
 | Column | Description |
| ------------------ | ----------------------------------------- |
| **Alert Name** | Identifier for the alert rule |
| **Status** | Active or disabled |
| **Last Triggered** | When the alert most recently fired |
| **Actions** | Enable, disable, edit, or delete the rule |
## Creating Alert Rules
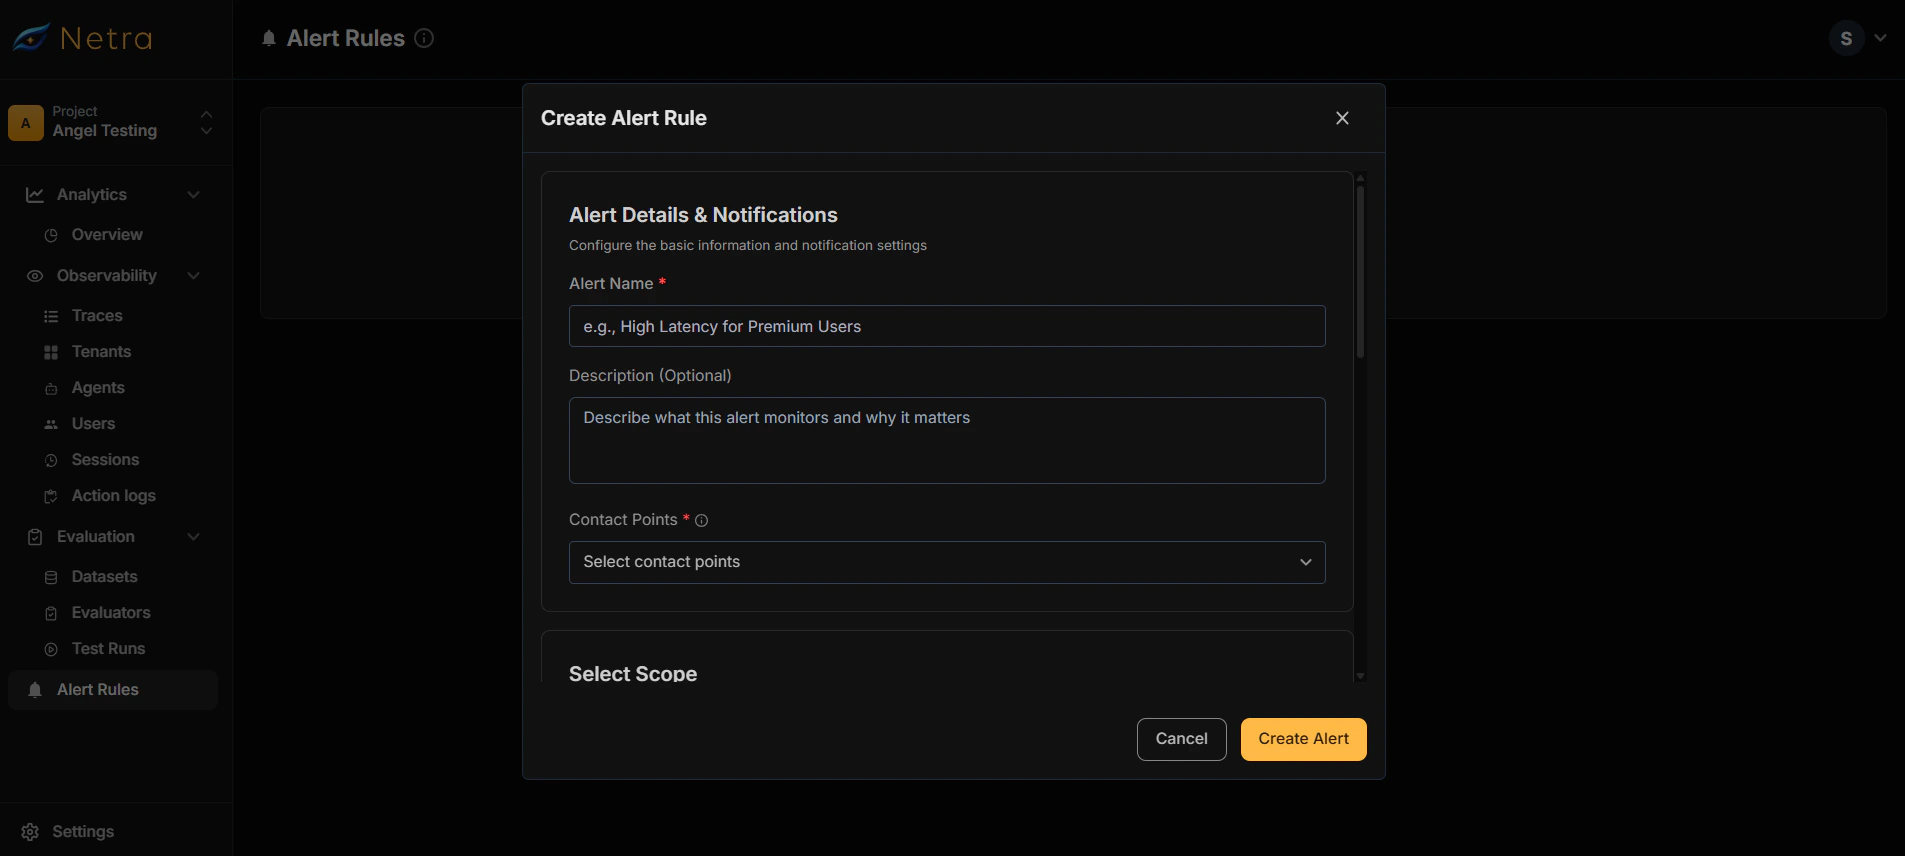
Click **Create Alert Rule** in the top right corner.
| Field | Description |
| --------------- | --------------------------------------------------------- |
| **Alert Name** | A descriptive name (e.g., "High Cost Alert - Production") |
| **Description** | Optional details about what the alert monitors |
Select where notifications should be sent when the alert triggers.
Contact points must be configured first in **Settings → Contact Points**. See [Configuring Contact Points](#configuring-contact-points) below.
Choose what level to monitor:
| Scope | Use Case |
| --------- | ---------------------------------------------------------- |
| **Trace** | Monitor entire requests end-to-end |
| **Span** | Monitor individual operations (LLM calls, tool executions) |
Choose what to measure:
* **Cost**: Token/API spend in USD
* **Latency**: Response time in milliseconds
* **Error Rate**: Percentage of failed requests
* **Token Count**: Input/output token usage
Narrow down which traces trigger the alert by filtering on:
* **Model**: Specific AI model (e.g., gpt-4, claude-3)
* **Tenant ID**: Monitor specific customers or organizations
* **Environment**: Production, staging, development
* **Service**: Particular microservice or component
Filters help reduce noise by limiting alerts to specific contexts. For example, monitor production costs separately from development.
Define when the alert should fire:
* **Threshold**: The value that triggers the alert
* **Operator**: Greater than, less than, equals
* **Time Window**: Evaluation period (optional)
Click **Create** to activate the alert rule.
## How Alerts Work
When trigger conditions are met, Netra:
1. **Evaluates** incoming [traces](/Observability/Traces/overview) against your alert rules
2. **Triggers** the alert when conditions match
3. **Sends notifications** to all configured contact points
4. **Updates** the alert's status and last triggered timestamp
Alerts evaluate in real-time as traces arrive. There's no polling delay—you're notified immediately when thresholds are breached.
## Configuring Contact Points
Before creating alerts, set up your notification channels.
Go to **Settings → Contact Points**.
Click **Create Contact Point** and provide:
* **Name**: A descriptive label (e.g., "Engineering Slack", "On-Call Email")
* **Integration**: Choose Email or Slack
Enter the email address(es) to receive notifications.
* Supports multiple recipients (comma-separated)
* Notifications include alert details, triggered values, and links to relevant traces
Choose your integration method:
**Option 1: Slack API**
* Provide the recipient channel or user
* Enter your Slack Bot token
**Option 2: Webhook URL**
* Create an [Incoming Webhook](https://api.slack.com/messaging/webhooks) in Slack
* Paste the webhook URL
Click **Create** to save the contact point. It's now available when creating alert rules.
## Use Cases
### Cost Monitoring
Prevent budget overruns:
1. Create an alert for **Cost > \$0.50** per trace
2. Set scope to **Trace** to monitor full request cost
3. Route to your finance or engineering Slack channel
### Latency SLAs
Ensure performance commitments:
1. Create an alert for **Latency > 3000ms**
2. Set scope to **Trace** for end-to-end latency
3. Notify your on-call team via email
### Error Detection
Catch failures early:
1. Create an alert for **Error Rate > 5%**
2. Set a time window to avoid false positives from single failures
3. Route to your incident management system
### Per-Tenant Monitoring
For [multi-tenant](/Observability/Tenants) applications:
1. Create alerts scoped to specific tenant IDs
2. Monitor per-tenant cost or error rates
3. Proactively reach out before customers report issues
## Managing Alerts
### Enable/Disable Alerts
Toggle alerts on or off without deleting them:
* Useful for maintenance windows
* Temporarily silence noisy alerts while investigating
### Edit Alert Rules
Modify existing alerts to:
* Adjust thresholds as your system scales
* Add or remove contact points
* Change scope or metrics
### Delete Alerts
Remove alerts that are no longer needed. This action is permanent.
## Best Practices
### Setting Thresholds
* **Start conservative**: Begin with higher thresholds and tighten over time
* **Use baseline data**: Review your [Dashboard](/Dashboard/Custom-dashboard) metrics to understand normal ranges
* **Account for variance**: Set thresholds above typical peaks to avoid alert fatigue
### Organizing Contact Points
* **Separate by severity**: Route critical alerts to on-call, informational alerts to Slack
* **Use descriptive names**: "Production Critical" vs "Dev Notifications"
* **Test before relying**: Send a test notification to verify delivery
### Avoiding Alert Fatigue
* **Be specific**: Narrow scope to reduce false positives
* **Set appropriate windows**: Use time-based aggregation for rate metrics
* **Review regularly**: Disable or tune alerts that fire too often without action
## Related
* [Quick Start: Alerts](/quick-start/QuickStart_Alerts) - Get started with alert rules
* [Traces](/Observability/Traces/overview) - Understand the data alerts monitor
* [Tenants](/Observability/Tenants) - Monitor per-customer metrics
* [Dashboard](/Dashboard/Custom-dashboard) - View metrics to inform threshold settings
| Column | Description |
| ------------------ | ----------------------------------------- |
| **Alert Name** | Identifier for the alert rule |
| **Status** | Active or disabled |
| **Last Triggered** | When the alert most recently fired |
| **Actions** | Enable, disable, edit, or delete the rule |
## Creating Alert Rules
Click **Create Alert Rule** in the top right corner.
| Field | Description |
| --------------- | --------------------------------------------------------- |
| **Alert Name** | A descriptive name (e.g., "High Cost Alert - Production") |
| **Description** | Optional details about what the alert monitors |
Select where notifications should be sent when the alert triggers.
Contact points must be configured first in **Settings → Contact Points**. See [Configuring Contact Points](#configuring-contact-points) below.
Choose what level to monitor:
| Scope | Use Case |
| --------- | ---------------------------------------------------------- |
| **Trace** | Monitor entire requests end-to-end |
| **Span** | Monitor individual operations (LLM calls, tool executions) |
Choose what to measure:
* **Cost**: Token/API spend in USD
* **Latency**: Response time in milliseconds
* **Error Rate**: Percentage of failed requests
* **Token Count**: Input/output token usage
Narrow down which traces trigger the alert by filtering on:
* **Model**: Specific AI model (e.g., gpt-4, claude-3)
* **Tenant ID**: Monitor specific customers or organizations
* **Environment**: Production, staging, development
* **Service**: Particular microservice or component
Filters help reduce noise by limiting alerts to specific contexts. For example, monitor production costs separately from development.
Define when the alert should fire:
* **Threshold**: The value that triggers the alert
* **Operator**: Greater than, less than, equals
* **Time Window**: Evaluation period (optional)
Click **Create** to activate the alert rule.
## How Alerts Work
When trigger conditions are met, Netra:
1. **Evaluates** incoming [traces](/Observability/Traces/overview) against your alert rules
2. **Triggers** the alert when conditions match
3. **Sends notifications** to all configured contact points
4. **Updates** the alert's status and last triggered timestamp
Alerts evaluate in real-time as traces arrive. There's no polling delay—you're notified immediately when thresholds are breached.
## Configuring Contact Points
Before creating alerts, set up your notification channels.
Go to **Settings → Contact Points**.
Click **Create Contact Point** and provide:
* **Name**: A descriptive label (e.g., "Engineering Slack", "On-Call Email")
* **Integration**: Choose Email or Slack
Enter the email address(es) to receive notifications.
* Supports multiple recipients (comma-separated)
* Notifications include alert details, triggered values, and links to relevant traces
Choose your integration method:
**Option 1: Slack API**
* Provide the recipient channel or user
* Enter your Slack Bot token
**Option 2: Webhook URL**
* Create an [Incoming Webhook](https://api.slack.com/messaging/webhooks) in Slack
* Paste the webhook URL
Click **Create** to save the contact point. It's now available when creating alert rules.
## Use Cases
### Cost Monitoring
Prevent budget overruns:
1. Create an alert for **Cost > \$0.50** per trace
2. Set scope to **Trace** to monitor full request cost
3. Route to your finance or engineering Slack channel
### Latency SLAs
Ensure performance commitments:
1. Create an alert for **Latency > 3000ms**
2. Set scope to **Trace** for end-to-end latency
3. Notify your on-call team via email
### Error Detection
Catch failures early:
1. Create an alert for **Error Rate > 5%**
2. Set a time window to avoid false positives from single failures
3. Route to your incident management system
### Per-Tenant Monitoring
For [multi-tenant](/Observability/Tenants) applications:
1. Create alerts scoped to specific tenant IDs
2. Monitor per-tenant cost or error rates
3. Proactively reach out before customers report issues
## Managing Alerts
### Enable/Disable Alerts
Toggle alerts on or off without deleting them:
* Useful for maintenance windows
* Temporarily silence noisy alerts while investigating
### Edit Alert Rules
Modify existing alerts to:
* Adjust thresholds as your system scales
* Add or remove contact points
* Change scope or metrics
### Delete Alerts
Remove alerts that are no longer needed. This action is permanent.
## Best Practices
### Setting Thresholds
* **Start conservative**: Begin with higher thresholds and tighten over time
* **Use baseline data**: Review your [Dashboard](/Dashboard/Custom-dashboard) metrics to understand normal ranges
* **Account for variance**: Set thresholds above typical peaks to avoid alert fatigue
### Organizing Contact Points
* **Separate by severity**: Route critical alerts to on-call, informational alerts to Slack
* **Use descriptive names**: "Production Critical" vs "Dev Notifications"
* **Test before relying**: Send a test notification to verify delivery
### Avoiding Alert Fatigue
* **Be specific**: Narrow scope to reduce false positives
* **Set appropriate windows**: Use time-based aggregation for rate metrics
* **Review regularly**: Disable or tune alerts that fire too often without action
## Related
* [Quick Start: Alerts](/quick-start/QuickStart_Alerts) - Get started with alert rules
* [Traces](/Observability/Traces/overview) - Understand the data alerts monitor
* [Tenants](/Observability/Tenants) - Monitor per-customer metrics
* [Dashboard](/Dashboard/Custom-dashboard) - View metrics to inform threshold settings